Asian vs Immigrants from Kazakhstan Hearing Disability
COMPARE
Asian
Immigrants from Kazakhstan
Hearing Disability
Hearing Disability Comparison
Asians
Immigrants from Kazakhstan
2.7%
HEARING DISABILITY
97.5/ 100
METRIC RATING
76th/ 347
METRIC RANK
2.9%
HEARING DISABILITY
69.6/ 100
METRIC RATING
157th/ 347
METRIC RANK
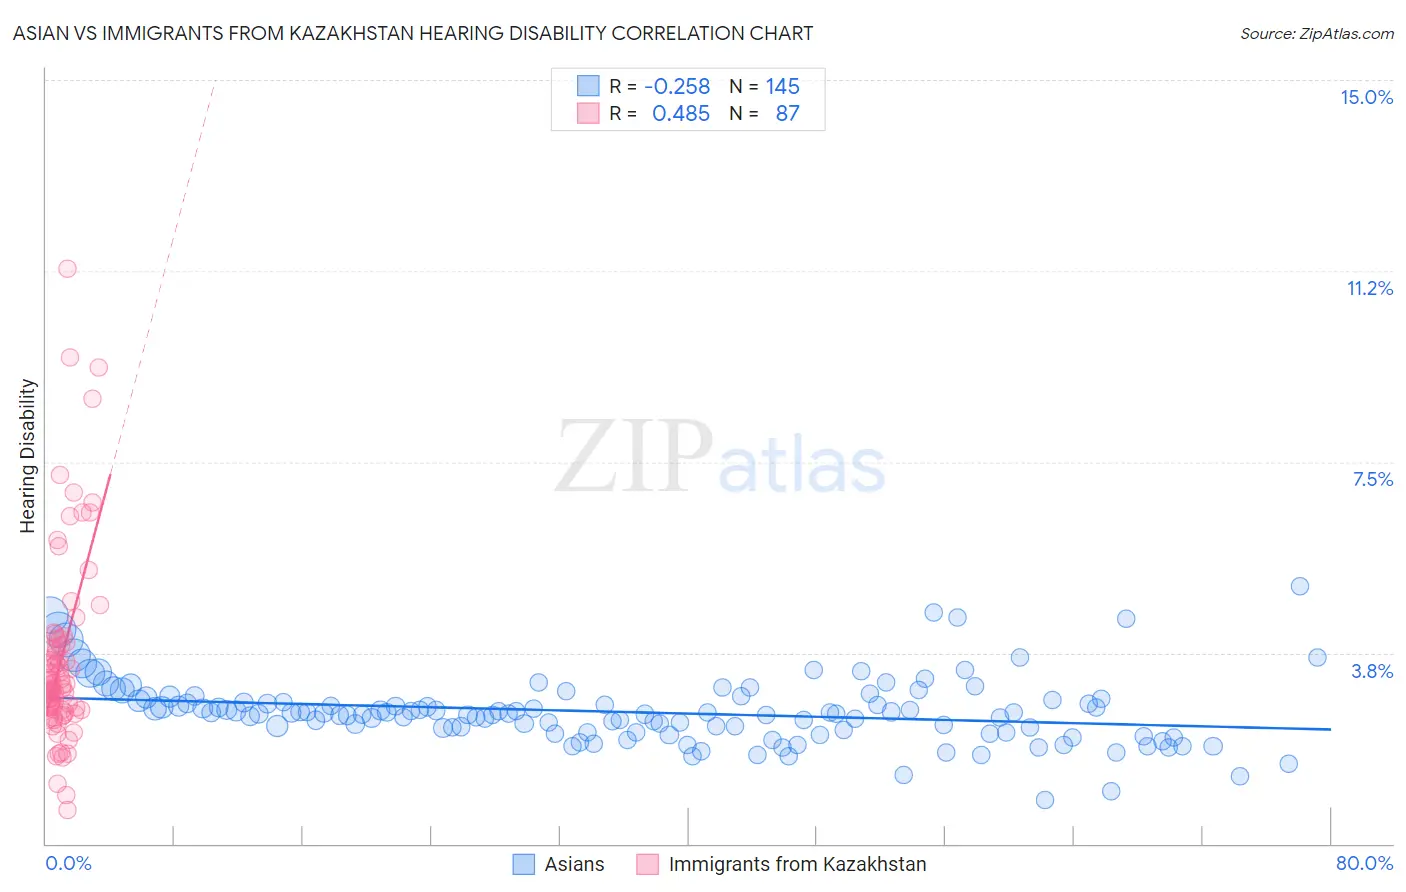
Asian vs Immigrants from Kazakhstan Hearing Disability Correlation Chart
The statistical analysis conducted on geographies consisting of 550,340,322 people shows a weak negative correlation between the proportion of Asians and percentage of population with hearing disability in the United States with a correlation coefficient (R) of -0.258 and weighted average of 2.7%. Similarly, the statistical analysis conducted on geographies consisting of 124,435,235 people shows a moderate positive correlation between the proportion of Immigrants from Kazakhstan and percentage of population with hearing disability in the United States with a correlation coefficient (R) of 0.485 and weighted average of 2.9%, a difference of 7.3%.
Hearing Disability Correlation Summary
| Measurement | Asian | Immigrants from Kazakhstan |
| Minimum | 0.87% | 0.67% |
| Maximum | 5.1% | 11.3% |
| Range | 4.2% | 10.6% |
| Mean | 2.6% | 3.6% |
| Median | 2.6% | 3.1% |
| Interquartile 25% (IQ1) | 2.2% | 2.6% |
| Interquartile 75% (IQ3) | 2.8% | 4.0% |
| Interquartile Range (IQR) | 0.60% | 1.3% |
| Standard Deviation (Sample) | 0.65% | 1.9% |
| Standard Deviation (Population) | 0.65% | 1.9% |
Similar Demographics by Hearing Disability
Demographics Similar to Asians by Hearing Disability
In terms of hearing disability, the demographic groups most similar to Asians are Immigrants from Saudi Arabia (2.7%, a difference of 0.0%), Immigrants from Malaysia (2.7%, a difference of 0.020%), Argentinean (2.7%, a difference of 0.030%), Immigrants from Korea (2.7%, a difference of 0.030%), and Mongolian (2.7%, a difference of 0.070%).
| Demographics | Rating | Rank | Hearing Disability |
| Nicaraguans | 97.9 /100 | #69 | Exceptional 2.7% |
| Peruvians | 97.7 /100 | #70 | Exceptional 2.7% |
| Central Americans | 97.7 /100 | #71 | Exceptional 2.7% |
| Afghans | 97.6 /100 | #72 | Exceptional 2.7% |
| Argentineans | 97.5 /100 | #73 | Exceptional 2.7% |
| Immigrants | Korea | 97.5 /100 | #74 | Exceptional 2.7% |
| Immigrants | Saudi Arabia | 97.5 /100 | #75 | Exceptional 2.7% |
| Asians | 97.5 /100 | #76 | Exceptional 2.7% |
| Immigrants | Malaysia | 97.5 /100 | #77 | Exceptional 2.7% |
| Mongolians | 97.4 /100 | #78 | Exceptional 2.7% |
| Colombians | 97.4 /100 | #79 | Exceptional 2.7% |
| Immigrants | Asia | 97.2 /100 | #80 | Exceptional 2.7% |
| Immigrants | Uruguay | 97.2 /100 | #81 | Exceptional 2.7% |
| Immigrants | Armenia | 97.2 /100 | #82 | Exceptional 2.7% |
| Immigrants | Cuba | 97.2 /100 | #83 | Exceptional 2.7% |
Demographics Similar to Immigrants from Kazakhstan by Hearing Disability
In terms of hearing disability, the demographic groups most similar to Immigrants from Kazakhstan are Immigrants from Burma/Myanmar (2.9%, a difference of 0.010%), Immigrants from Poland (2.9%, a difference of 0.070%), Costa Rican (2.9%, a difference of 0.21%), Immigrants from Lebanon (2.9%, a difference of 0.22%), and Immigrants from Australia (2.9%, a difference of 0.25%).
| Demographics | Rating | Rank | Hearing Disability |
| Palestinians | 73.6 /100 | #150 | Good 2.9% |
| Immigrants | France | 73.1 /100 | #151 | Good 2.9% |
| Immigrants | Lithuania | 73.0 /100 | #152 | Good 2.9% |
| Sudanese | 72.1 /100 | #153 | Good 2.9% |
| Immigrants | Lebanon | 71.5 /100 | #154 | Good 2.9% |
| Costa Ricans | 71.4 /100 | #155 | Good 2.9% |
| Immigrants | Poland | 70.2 /100 | #156 | Good 2.9% |
| Immigrants | Kazakhstan | 69.6 /100 | #157 | Good 2.9% |
| Immigrants | Burma/Myanmar | 69.5 /100 | #158 | Good 2.9% |
| Immigrants | Australia | 67.4 /100 | #159 | Good 2.9% |
| Immigrants | Fiji | 67.1 /100 | #160 | Good 2.9% |
| Albanians | 66.6 /100 | #161 | Good 2.9% |
| Immigrants | Japan | 66.3 /100 | #162 | Good 2.9% |
| Immigrants | Central America | 64.9 /100 | #163 | Good 3.0% |
| Immigrants | Cambodia | 64.8 /100 | #164 | Good 3.0% |