British vs Immigrants from Kazakhstan In Labor Force | Age 30-34
COMPARE
British
Immigrants from Kazakhstan
In Labor Force | Age 30-34
In Labor Force | Age 30-34 Comparison
British
Immigrants from Kazakhstan
84.5%
IN LABOR FORCE | AGE 30-34
22.9/ 100
METRIC RATING
196th/ 347
METRIC RANK
85.3%
IN LABOR FORCE | AGE 30-34
98.1/ 100
METRIC RATING
89th/ 347
METRIC RANK
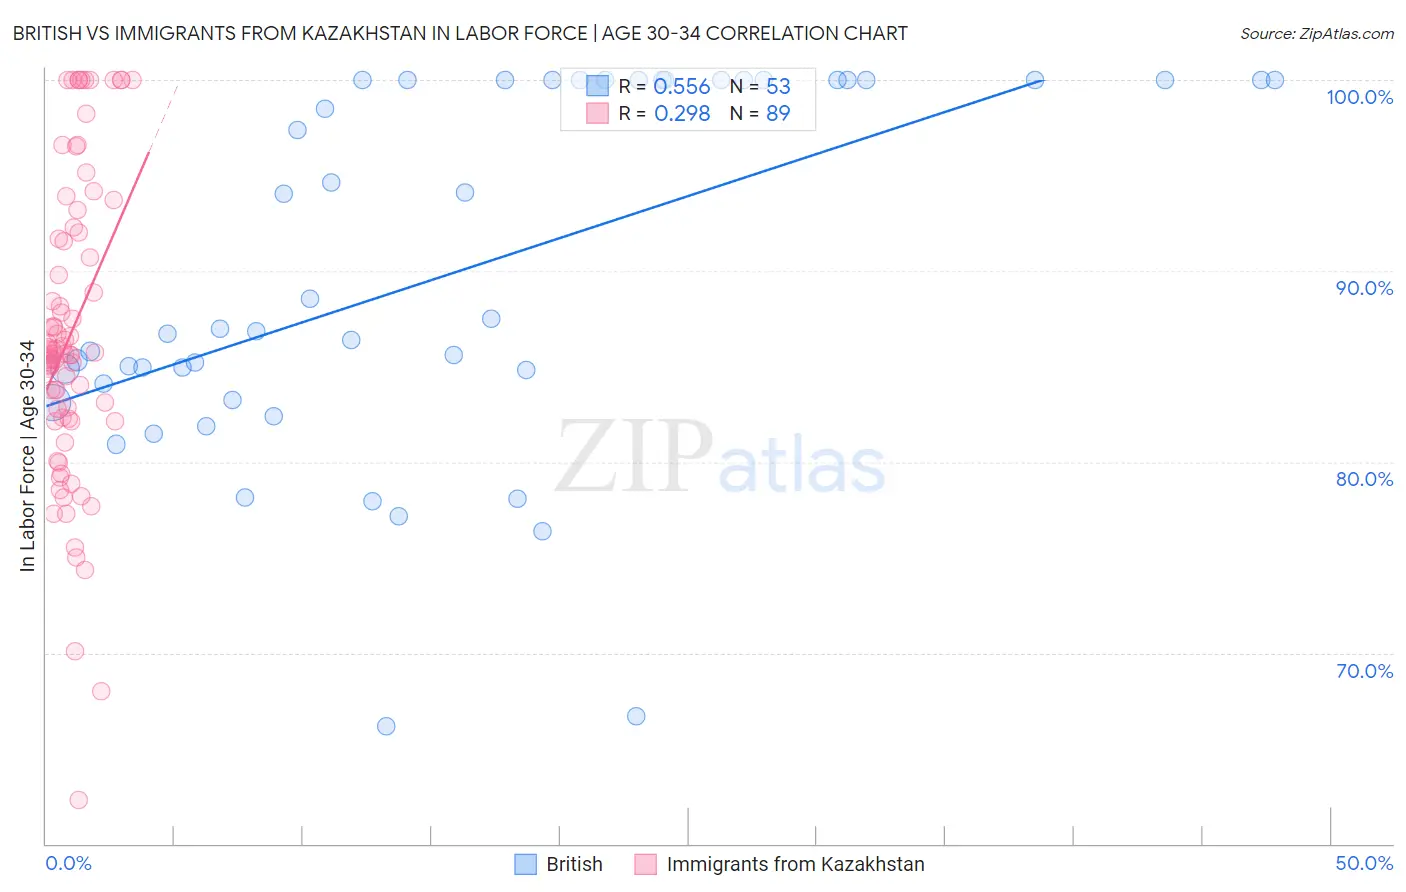
British vs Immigrants from Kazakhstan In Labor Force | Age 30-34 Correlation Chart
The statistical analysis conducted on geographies consisting of 530,789,592 people shows a substantial positive correlation between the proportion of British and labor force participation rate among population between the ages 30 and 34 in the United States with a correlation coefficient (R) of 0.556 and weighted average of 84.5%. Similarly, the statistical analysis conducted on geographies consisting of 124,415,463 people shows a weak positive correlation between the proportion of Immigrants from Kazakhstan and labor force participation rate among population between the ages 30 and 34 in the United States with a correlation coefficient (R) of 0.298 and weighted average of 85.3%, a difference of 0.91%.
In Labor Force | Age 30-34 Correlation Summary
| Measurement | British | Immigrants from Kazakhstan |
| Minimum | 66.1% | 62.3% |
| Maximum | 100.0% | 100.0% |
| Range | 33.9% | 37.7% |
| Mean | 89.9% | 86.7% |
| Median | 87.0% | 85.7% |
| Interquartile 25% (IQ1) | 83.7% | 82.3% |
| Interquartile 75% (IQ3) | 100.0% | 91.8% |
| Interquartile Range (IQR) | 16.3% | 9.5% |
| Standard Deviation (Sample) | 9.4% | 7.8% |
| Standard Deviation (Population) | 9.4% | 7.8% |
Similar Demographics by In Labor Force | Age 30-34
Demographics Similar to British by In Labor Force | Age 30-34
In terms of in labor force | age 30-34, the demographic groups most similar to British are Korean (84.5%, a difference of 0.0%), Immigrants from Costa Rica (84.5%, a difference of 0.010%), Immigrants from Afghanistan (84.5%, a difference of 0.010%), Immigrants from Syria (84.5%, a difference of 0.010%), and Hungarian (84.5%, a difference of 0.020%).
| Demographics | Rating | Rank | In Labor Force | Age 30-34 |
| Nigerians | 28.9 /100 | #189 | Fair 84.5% |
| Immigrants | Zaire | 25.8 /100 | #190 | Fair 84.5% |
| Hungarians | 24.8 /100 | #191 | Fair 84.5% |
| Scandinavians | 24.7 /100 | #192 | Fair 84.5% |
| Immigrants | Costa Rica | 23.9 /100 | #193 | Fair 84.5% |
| Immigrants | Afghanistan | 23.5 /100 | #194 | Fair 84.5% |
| Koreans | 23.2 /100 | #195 | Fair 84.5% |
| British | 22.9 /100 | #196 | Fair 84.5% |
| Immigrants | Syria | 21.9 /100 | #197 | Fair 84.5% |
| Dutch | 20.2 /100 | #198 | Fair 84.5% |
| Immigrants | Thailand | 19.1 /100 | #199 | Poor 84.5% |
| Sub-Saharan Africans | 19.0 /100 | #200 | Poor 84.5% |
| Trinidadians and Tobagonians | 18.2 /100 | #201 | Poor 84.5% |
| Immigrants | West Indies | 18.1 /100 | #202 | Poor 84.5% |
| Canadians | 15.4 /100 | #203 | Poor 84.4% |
Demographics Similar to Immigrants from Kazakhstan by In Labor Force | Age 30-34
In terms of in labor force | age 30-34, the demographic groups most similar to Immigrants from Kazakhstan are Immigrants from Northern Europe (85.3%, a difference of 0.010%), Immigrants from Belgium (85.3%, a difference of 0.010%), Immigrants from Taiwan (85.3%, a difference of 0.020%), Burmese (85.3%, a difference of 0.020%), and Immigrants from Moldova (85.3%, a difference of 0.020%).
| Demographics | Rating | Rank | In Labor Force | Age 30-34 |
| Immigrants | Africa | 98.6 /100 | #82 | Exceptional 85.3% |
| Immigrants | Europe | 98.6 /100 | #83 | Exceptional 85.3% |
| Greeks | 98.6 /100 | #84 | Exceptional 85.3% |
| Mongolians | 98.5 /100 | #85 | Exceptional 85.3% |
| Immigrants | Taiwan | 98.3 /100 | #86 | Exceptional 85.3% |
| Immigrants | Northern Europe | 98.2 /100 | #87 | Exceptional 85.3% |
| Immigrants | Belgium | 98.2 /100 | #88 | Exceptional 85.3% |
| Immigrants | Kazakhstan | 98.1 /100 | #89 | Exceptional 85.3% |
| Burmese | 97.9 /100 | #90 | Exceptional 85.3% |
| Immigrants | Moldova | 97.9 /100 | #91 | Exceptional 85.3% |
| German Russians | 97.7 /100 | #92 | Exceptional 85.2% |
| Immigrants | Norway | 97.6 /100 | #93 | Exceptional 85.2% |
| Swedes | 97.5 /100 | #94 | Exceptional 85.2% |
| Immigrants | India | 97.4 /100 | #95 | Exceptional 85.2% |
| Immigrants | Korea | 97.3 /100 | #96 | Exceptional 85.2% |