British vs Immigrants from Ecuador Doctorate Degree
COMPARE
British
Immigrants from Ecuador
Doctorate Degree
Doctorate Degree Comparison
British
Immigrants from Ecuador
2.2%
DOCTORATE DEGREE
99.3/ 100
METRIC RATING
89th/ 347
METRIC RANK
1.4%
DOCTORATE DEGREE
0.2/ 100
METRIC RATING
296th/ 347
METRIC RANK
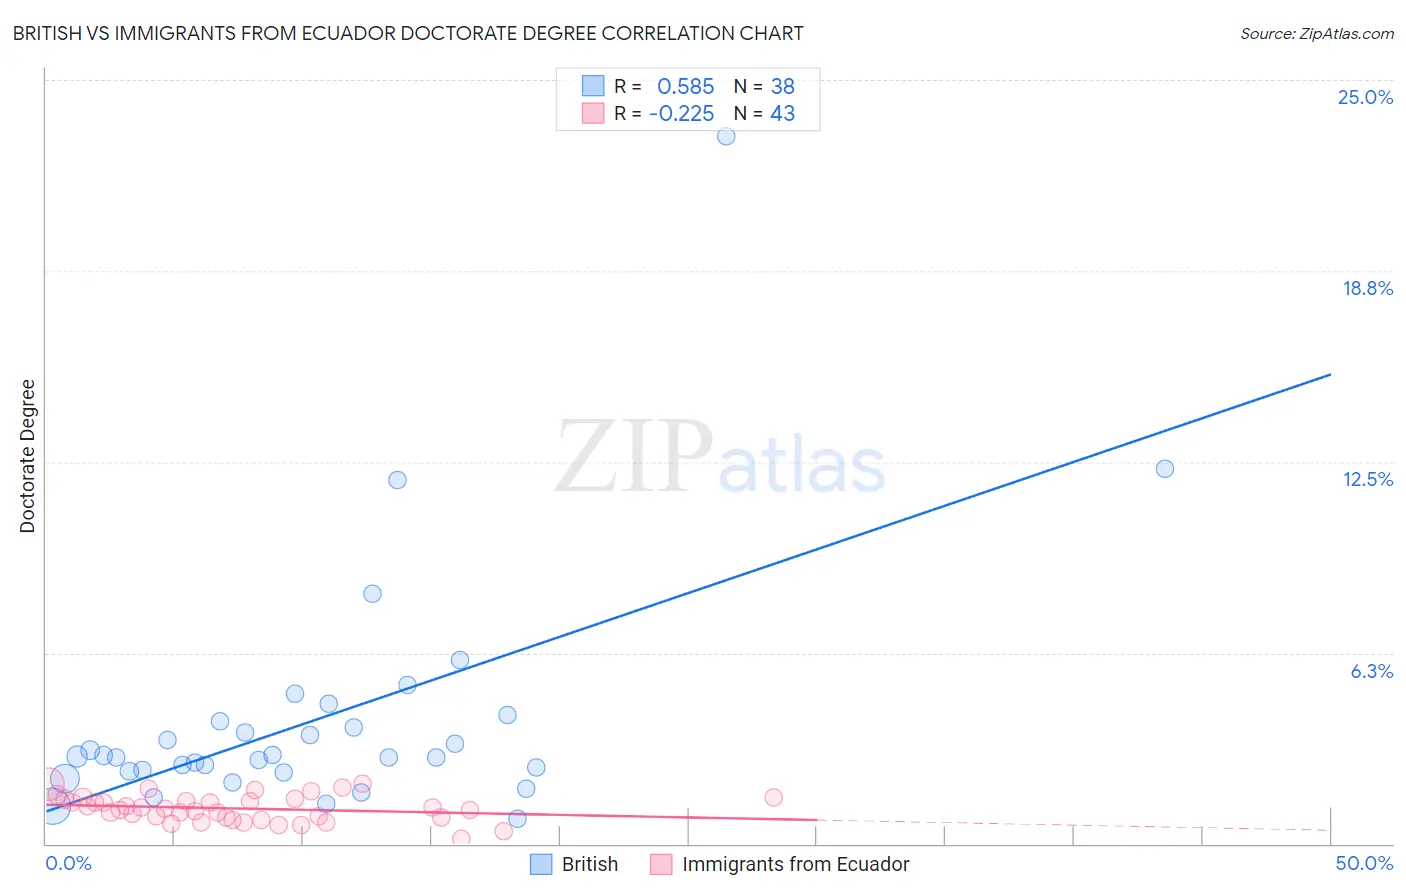
British vs Immigrants from Ecuador Doctorate Degree Correlation Chart
The statistical analysis conducted on geographies consisting of 517,011,664 people shows a substantial positive correlation between the proportion of British and percentage of population with at least doctorate degree education in the United States with a correlation coefficient (R) of 0.585 and weighted average of 2.2%. Similarly, the statistical analysis conducted on geographies consisting of 269,753,528 people shows a weak negative correlation between the proportion of Immigrants from Ecuador and percentage of population with at least doctorate degree education in the United States with a correlation coefficient (R) of -0.225 and weighted average of 1.4%, a difference of 53.9%.
Doctorate Degree Correlation Summary
| Measurement | British | Immigrants from Ecuador |
| Minimum | 0.83% | 0.16% |
| Maximum | 23.1% | 2.0% |
| Range | 22.3% | 1.8% |
| Mean | 4.1% | 1.2% |
| Median | 2.8% | 1.2% |
| Interquartile 25% (IQ1) | 2.4% | 0.84% |
| Interquartile 75% (IQ3) | 4.0% | 1.5% |
| Interquartile Range (IQR) | 1.6% | 0.62% |
| Standard Deviation (Sample) | 4.0% | 0.42% |
| Standard Deviation (Population) | 4.0% | 0.42% |
Similar Demographics by Doctorate Degree
Demographics Similar to British by Doctorate Degree
In terms of doctorate degree, the demographic groups most similar to British are Immigrants from Scotland (2.2%, a difference of 0.020%), Immigrants from Nepal (2.2%, a difference of 0.44%), Immigrants from Sudan (2.2%, a difference of 0.49%), Chilean (2.2%, a difference of 0.75%), and Immigrants from Zimbabwe (2.2%, a difference of 0.80%).
| Demographics | Rating | Rank | Doctorate Degree |
| Immigrants | Uganda | 99.6 /100 | #82 | Exceptional 2.2% |
| Immigrants | Lithuania | 99.6 /100 | #83 | Exceptional 2.2% |
| Immigrants | England | 99.6 /100 | #84 | Exceptional 2.2% |
| Immigrants | Brazil | 99.6 /100 | #85 | Exceptional 2.2% |
| Egyptians | 99.4 /100 | #86 | Exceptional 2.2% |
| Immigrants | Zimbabwe | 99.4 /100 | #87 | Exceptional 2.2% |
| Immigrants | Nepal | 99.3 /100 | #88 | Exceptional 2.2% |
| British | 99.3 /100 | #89 | Exceptional 2.2% |
| Immigrants | Scotland | 99.2 /100 | #90 | Exceptional 2.2% |
| Immigrants | Sudan | 99.1 /100 | #91 | Exceptional 2.2% |
| Chileans | 99.1 /100 | #92 | Exceptional 2.2% |
| Alsatians | 99.0 /100 | #93 | Exceptional 2.1% |
| Greeks | 98.8 /100 | #94 | Exceptional 2.1% |
| Immigrants | Romania | 98.7 /100 | #95 | Exceptional 2.1% |
| Immigrants | Northern Africa | 98.4 /100 | #96 | Exceptional 2.1% |
Demographics Similar to Immigrants from Ecuador by Doctorate Degree
In terms of doctorate degree, the demographic groups most similar to Immigrants from Ecuador are Tsimshian (1.4%, a difference of 0.22%), Guatemalan (1.4%, a difference of 0.23%), Puerto Rican (1.4%, a difference of 0.63%), Samoan (1.4%, a difference of 0.94%), and Belizean (1.4%, a difference of 1.1%).
| Demographics | Rating | Rank | Doctorate Degree |
| Cape Verdeans | 0.3 /100 | #289 | Tragic 1.4% |
| Choctaw | 0.3 /100 | #290 | Tragic 1.4% |
| Blacks/African Americans | 0.3 /100 | #291 | Tragic 1.4% |
| Alaska Natives | 0.3 /100 | #292 | Tragic 1.4% |
| Immigrants | Yemen | 0.2 /100 | #293 | Tragic 1.4% |
| Samoans | 0.2 /100 | #294 | Tragic 1.4% |
| Guatemalans | 0.2 /100 | #295 | Tragic 1.4% |
| Immigrants | Ecuador | 0.2 /100 | #296 | Tragic 1.4% |
| Tsimshian | 0.2 /100 | #297 | Tragic 1.4% |
| Puerto Ricans | 0.1 /100 | #298 | Tragic 1.4% |
| Belizeans | 0.1 /100 | #299 | Tragic 1.4% |
| Immigrants | Guatemala | 0.1 /100 | #300 | Tragic 1.4% |
| Hondurans | 0.1 /100 | #301 | Tragic 1.4% |
| Shoshone | 0.1 /100 | #302 | Tragic 1.4% |
| Immigrants | Dominica | 0.1 /100 | #303 | Tragic 1.4% |