British vs Navajo Vision Disability
COMPARE
British
Navajo
Vision Disability
Vision Disability Comparison
British
Navajo
2.2%
VISION DISABILITY
25.1/ 100
METRIC RATING
193rd/ 347
METRIC RANK
3.1%
VISION DISABILITY
0.0/ 100
METRIC RATING
335th/ 347
METRIC RANK
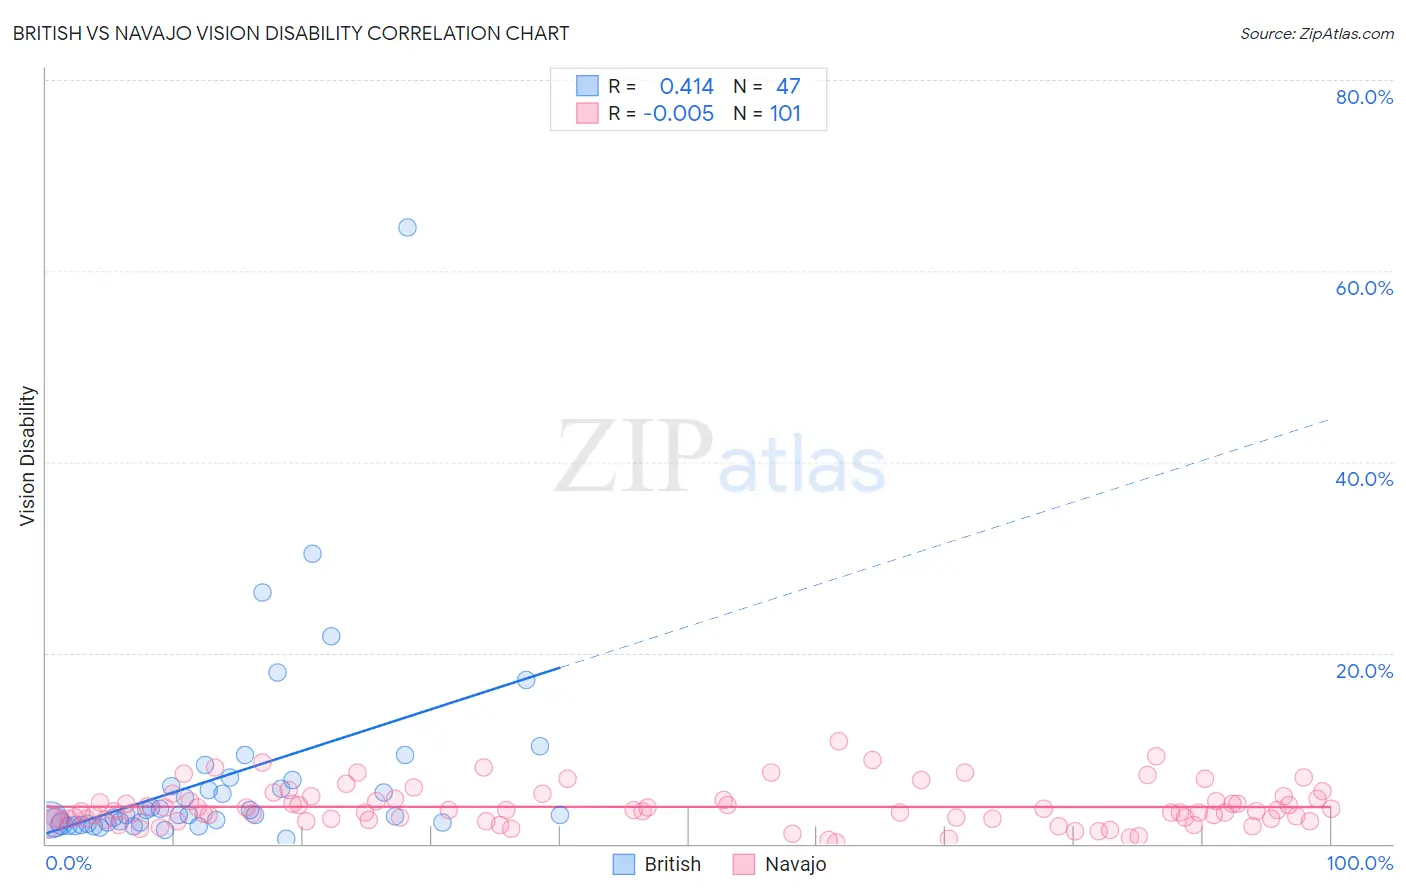
British vs Navajo Vision Disability Correlation Chart
The statistical analysis conducted on geographies consisting of 530,471,861 people shows a moderate positive correlation between the proportion of British and percentage of population with vision disability in the United States with a correlation coefficient (R) of 0.414 and weighted average of 2.2%. Similarly, the statistical analysis conducted on geographies consisting of 224,647,940 people shows no correlation between the proportion of Navajo and percentage of population with vision disability in the United States with a correlation coefficient (R) of -0.005 and weighted average of 3.1%, a difference of 42.7%.
Vision Disability Correlation Summary
| Measurement | British | Navajo |
| Minimum | 0.53% | 0.16% |
| Maximum | 64.6% | 10.7% |
| Range | 64.1% | 10.6% |
| Mean | 7.1% | 3.9% |
| Median | 3.0% | 3.4% |
| Interquartile 25% (IQ1) | 2.2% | 2.6% |
| Interquartile 75% (IQ3) | 6.6% | 4.7% |
| Interquartile Range (IQR) | 4.5% | 2.2% |
| Standard Deviation (Sample) | 10.8% | 2.1% |
| Standard Deviation (Population) | 10.7% | 2.1% |
Similar Demographics by Vision Disability
Demographics Similar to British by Vision Disability
In terms of vision disability, the demographic groups most similar to British are European (2.2%, a difference of 0.050%), Canadian (2.2%, a difference of 0.060%), Immigrants from Costa Rica (2.2%, a difference of 0.080%), Immigrants from Barbados (2.2%, a difference of 0.090%), and Immigrants (2.2%, a difference of 0.11%).
| Demographics | Rating | Rank | Vision Disability |
| Native Hawaiians | 33.3 /100 | #186 | Fair 2.2% |
| Immigrants | St. Vincent and the Grenadines | 30.3 /100 | #187 | Fair 2.2% |
| Guyanese | 28.9 /100 | #188 | Fair 2.2% |
| Salvadorans | 27.4 /100 | #189 | Fair 2.2% |
| Immigrants | Costa Rica | 26.1 /100 | #190 | Fair 2.2% |
| Canadians | 25.8 /100 | #191 | Fair 2.2% |
| Europeans | 25.7 /100 | #192 | Fair 2.2% |
| British | 25.1 /100 | #193 | Fair 2.2% |
| Immigrants | Barbados | 24.0 /100 | #194 | Fair 2.2% |
| Immigrants | Immigrants | 23.7 /100 | #195 | Fair 2.2% |
| Immigrants | Grenada | 23.1 /100 | #196 | Fair 2.2% |
| Ghanaians | 21.8 /100 | #197 | Fair 2.2% |
| Czechoslovakians | 21.6 /100 | #198 | Fair 2.2% |
| Immigrants | El Salvador | 21.0 /100 | #199 | Fair 2.2% |
| Immigrants | Thailand | 20.1 /100 | #200 | Fair 2.2% |
Demographics Similar to Navajo by Vision Disability
In terms of vision disability, the demographic groups most similar to Navajo are Alaskan Athabascan (3.1%, a difference of 0.16%), Dutch West Indian (3.2%, a difference of 0.19%), Chickasaw (3.2%, a difference of 1.1%), Cheyenne (3.1%, a difference of 1.7%), and Tsimshian (3.2%, a difference of 1.8%).
| Demographics | Rating | Rank | Vision Disability |
| Yuman | 0.0 /100 | #328 | Tragic 3.0% |
| Apache | 0.0 /100 | #329 | Tragic 3.0% |
| Colville | 0.0 /100 | #330 | Tragic 3.0% |
| Central American Indians | 0.0 /100 | #331 | Tragic 3.0% |
| Seminole | 0.0 /100 | #332 | Tragic 3.1% |
| Cajuns | 0.0 /100 | #333 | Tragic 3.1% |
| Cheyenne | 0.0 /100 | #334 | Tragic 3.1% |
| Navajo | 0.0 /100 | #335 | Tragic 3.1% |
| Alaskan Athabascans | 0.0 /100 | #336 | Tragic 3.1% |
| Dutch West Indians | 0.0 /100 | #337 | Tragic 3.2% |
| Chickasaw | 0.0 /100 | #338 | Tragic 3.2% |
| Tsimshian | 0.0 /100 | #339 | Tragic 3.2% |
| Creek | 0.0 /100 | #340 | Tragic 3.2% |
| Kiowa | 0.0 /100 | #341 | Tragic 3.3% |
| Choctaw | 0.0 /100 | #342 | Tragic 3.3% |