Bolivian vs Immigrants from Bosnia and Herzegovina Ambulatory Disability
COMPARE
Bolivian
Immigrants from Bosnia and Herzegovina
Ambulatory Disability
Ambulatory Disability Comparison
Bolivians
Immigrants from Bosnia and Herzegovina
5.1%
AMBULATORY DISABILITY
100.0/ 100
METRIC RATING
7th/ 347
METRIC RANK
6.2%
AMBULATORY DISABILITY
37.2/ 100
METRIC RATING
185th/ 347
METRIC RANK
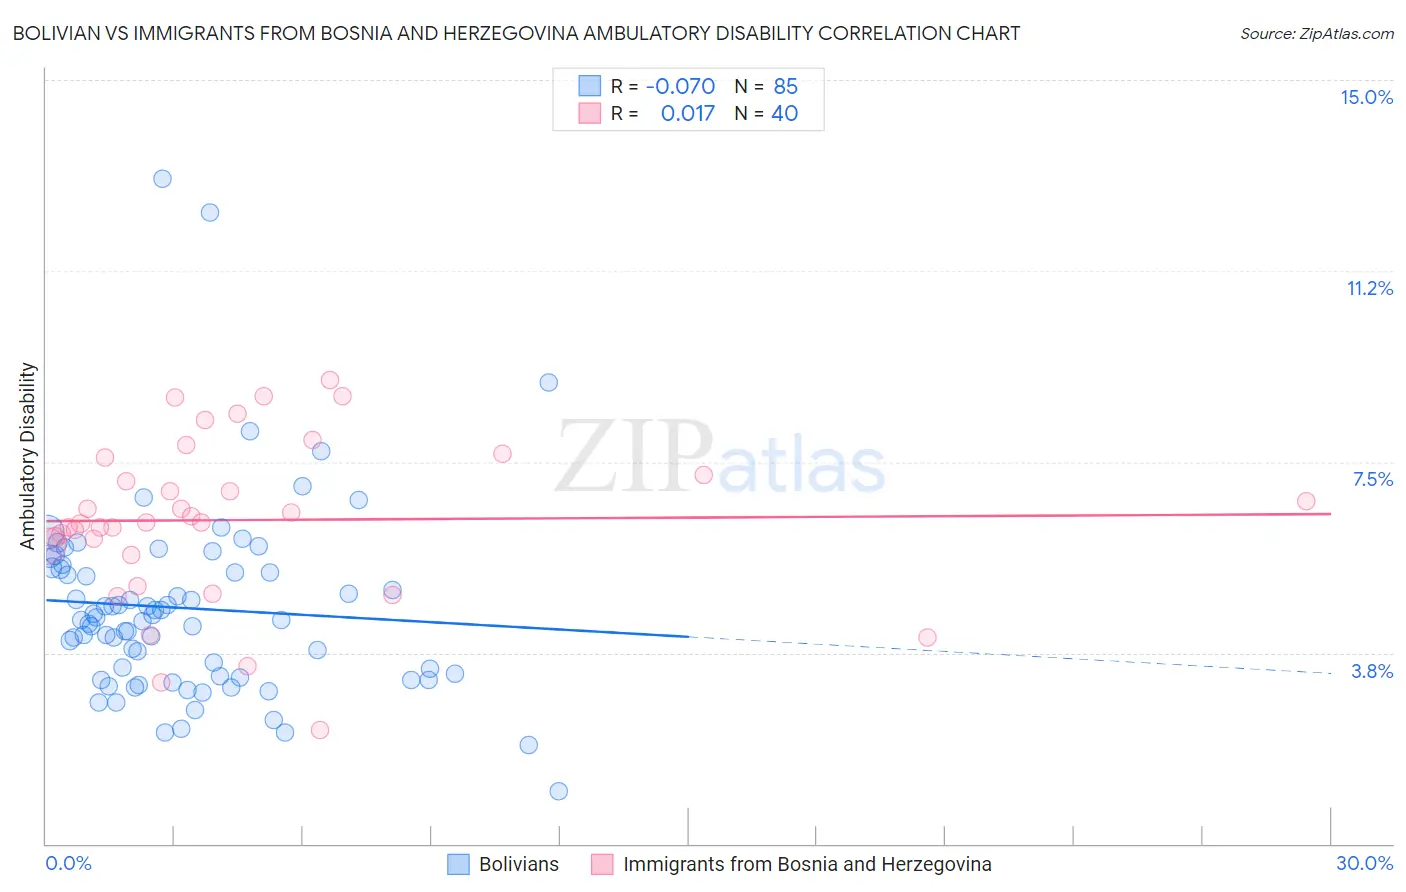
Bolivian vs Immigrants from Bosnia and Herzegovina Ambulatory Disability Correlation Chart
The statistical analysis conducted on geographies consisting of 184,650,218 people shows a slight negative correlation between the proportion of Bolivians and percentage of population with ambulatory disability in the United States with a correlation coefficient (R) of -0.070 and weighted average of 5.1%. Similarly, the statistical analysis conducted on geographies consisting of 156,818,181 people shows no correlation between the proportion of Immigrants from Bosnia and Herzegovina and percentage of population with ambulatory disability in the United States with a correlation coefficient (R) of 0.017 and weighted average of 6.2%, a difference of 21.8%.
Ambulatory Disability Correlation Summary
| Measurement | Bolivian | Immigrants from Bosnia and Herzegovina |
| Minimum | 1.0% | 2.2% |
| Maximum | 13.1% | 9.1% |
| Range | 12.0% | 6.9% |
| Mean | 4.6% | 6.4% |
| Median | 4.4% | 6.3% |
| Interquartile 25% (IQ1) | 3.3% | 5.8% |
| Interquartile 75% (IQ3) | 5.4% | 7.4% |
| Interquartile Range (IQR) | 2.1% | 1.7% |
| Standard Deviation (Sample) | 1.9% | 1.6% |
| Standard Deviation (Population) | 1.9% | 1.6% |
Similar Demographics by Ambulatory Disability
Demographics Similar to Bolivians by Ambulatory Disability
In terms of ambulatory disability, the demographic groups most similar to Bolivians are Immigrants from Bolivia (5.0%, a difference of 0.38%), Immigrants from South Central Asia (5.1%, a difference of 0.99%), Immigrants from Singapore (5.0%, a difference of 1.1%), Iranian (5.1%, a difference of 1.4%), and Yup'ik (5.2%, a difference of 2.0%).
| Demographics | Rating | Rank | Ambulatory Disability |
| Immigrants | India | 100.0 /100 | #1 | Exceptional 4.8% |
| Filipinos | 100.0 /100 | #2 | Exceptional 4.9% |
| Thais | 100.0 /100 | #3 | Exceptional 4.9% |
| Immigrants | Taiwan | 100.0 /100 | #4 | Exceptional 4.9% |
| Immigrants | Singapore | 100.0 /100 | #5 | Exceptional 5.0% |
| Immigrants | Bolivia | 100.0 /100 | #6 | Exceptional 5.0% |
| Bolivians | 100.0 /100 | #7 | Exceptional 5.1% |
| Immigrants | South Central Asia | 100.0 /100 | #8 | Exceptional 5.1% |
| Iranians | 100.0 /100 | #9 | Exceptional 5.1% |
| Yup'ik | 100.0 /100 | #10 | Exceptional 5.2% |
| Immigrants | Korea | 100.0 /100 | #11 | Exceptional 5.2% |
| Okinawans | 100.0 /100 | #12 | Exceptional 5.3% |
| Burmese | 100.0 /100 | #13 | Exceptional 5.3% |
| Immigrants | Eastern Asia | 100.0 /100 | #14 | Exceptional 5.3% |
| Immigrants | China | 100.0 /100 | #15 | Exceptional 5.3% |
Demographics Similar to Immigrants from Bosnia and Herzegovina by Ambulatory Disability
In terms of ambulatory disability, the demographic groups most similar to Immigrants from Bosnia and Herzegovina are European (6.2%, a difference of 0.060%), Carpatho Rusyn (6.2%, a difference of 0.11%), British (6.2%, a difference of 0.17%), Ukrainian (6.2%, a difference of 0.19%), and Immigrants from Ghana (6.1%, a difference of 0.22%).
| Demographics | Rating | Rank | Ambulatory Disability |
| Scandinavians | 44.5 /100 | #178 | Average 6.1% |
| Austrians | 44.1 /100 | #179 | Average 6.1% |
| Immigrants | Nicaragua | 43.9 /100 | #180 | Average 6.1% |
| Swiss | 43.1 /100 | #181 | Average 6.1% |
| Serbians | 42.8 /100 | #182 | Average 6.1% |
| Immigrants | Thailand | 42.2 /100 | #183 | Average 6.1% |
| Immigrants | Ghana | 41.2 /100 | #184 | Average 6.1% |
| Immigrants | Bosnia and Herzegovina | 37.2 /100 | #185 | Fair 6.2% |
| Europeans | 36.2 /100 | #186 | Fair 6.2% |
| Carpatho Rusyns | 35.3 /100 | #187 | Fair 6.2% |
| British | 34.3 /100 | #188 | Fair 6.2% |
| Ukrainians | 34.0 /100 | #189 | Fair 6.2% |
| Immigrants | Western Africa | 33.4 /100 | #190 | Fair 6.2% |
| Immigrants | Guatemala | 31.9 /100 | #191 | Fair 6.2% |
| Immigrants | Western Europe | 31.6 /100 | #192 | Fair 6.2% |