Bolivian vs Immigrants from Venezuela Ambulatory Disability
COMPARE
Bolivian
Immigrants from Venezuela
Ambulatory Disability
Ambulatory Disability Comparison
Bolivians
Immigrants from Venezuela
5.1%
AMBULATORY DISABILITY
100.0/ 100
METRIC RATING
7th/ 347
METRIC RANK
5.4%
AMBULATORY DISABILITY
100.0/ 100
METRIC RATING
31st/ 347
METRIC RANK
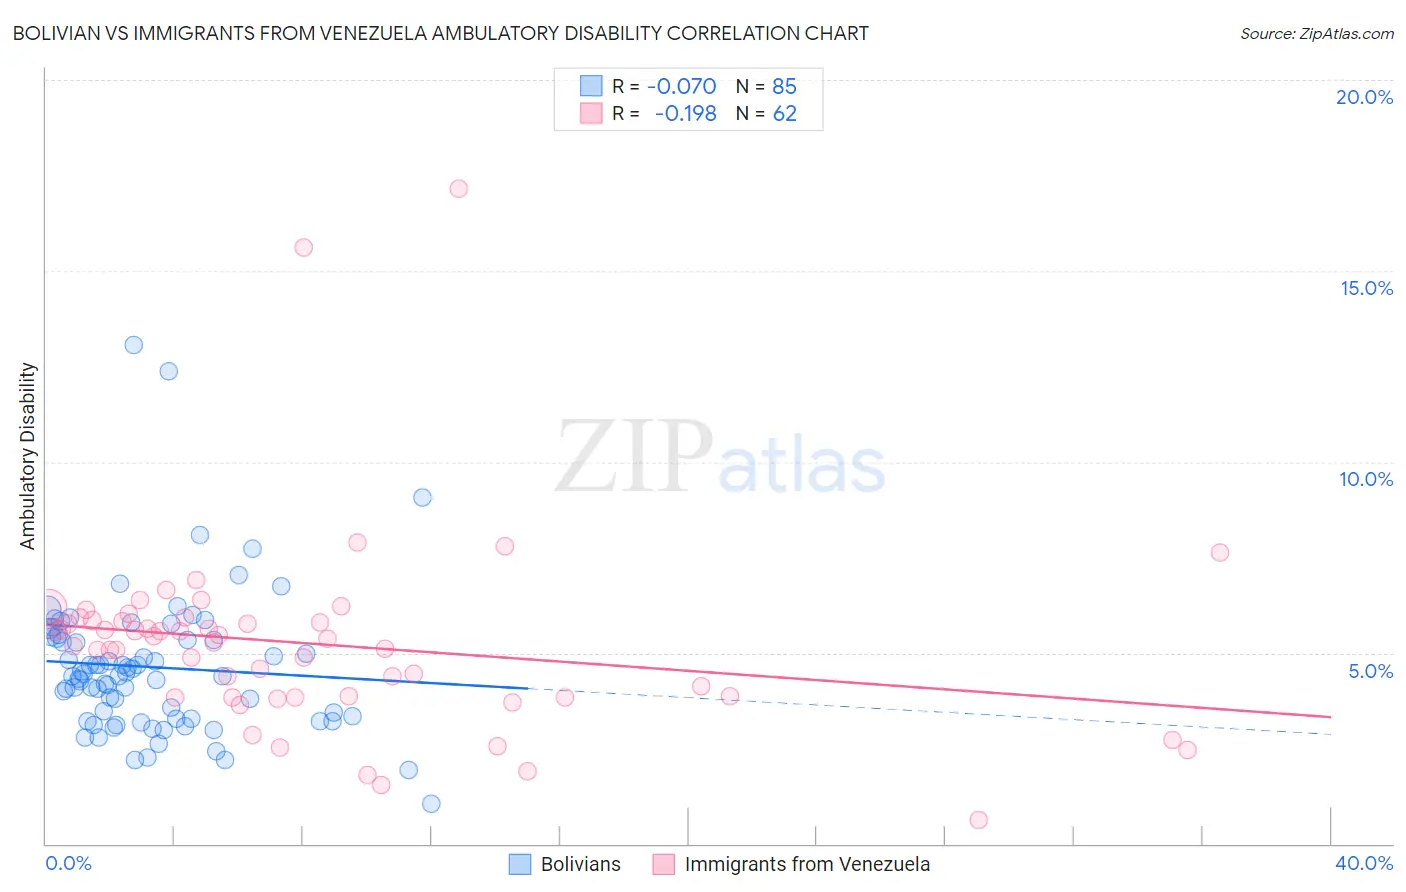
Bolivian vs Immigrants from Venezuela Ambulatory Disability Correlation Chart
The statistical analysis conducted on geographies consisting of 184,650,218 people shows a slight negative correlation between the proportion of Bolivians and percentage of population with ambulatory disability in the United States with a correlation coefficient (R) of -0.070 and weighted average of 5.1%. Similarly, the statistical analysis conducted on geographies consisting of 287,823,079 people shows a poor negative correlation between the proportion of Immigrants from Venezuela and percentage of population with ambulatory disability in the United States with a correlation coefficient (R) of -0.198 and weighted average of 5.4%, a difference of 7.7%.
Ambulatory Disability Correlation Summary
| Measurement | Bolivian | Immigrants from Venezuela |
| Minimum | 1.0% | 0.63% |
| Maximum | 13.1% | 17.1% |
| Range | 12.0% | 16.5% |
| Mean | 4.6% | 5.2% |
| Median | 4.4% | 5.3% |
| Interquartile 25% (IQ1) | 3.3% | 3.8% |
| Interquartile 75% (IQ3) | 5.4% | 5.8% |
| Interquartile Range (IQR) | 2.1% | 2.0% |
| Standard Deviation (Sample) | 1.9% | 2.6% |
| Standard Deviation (Population) | 1.9% | 2.5% |
Similar Demographics by Ambulatory Disability
Demographics Similar to Bolivians by Ambulatory Disability
In terms of ambulatory disability, the demographic groups most similar to Bolivians are Immigrants from Bolivia (5.0%, a difference of 0.38%), Immigrants from South Central Asia (5.1%, a difference of 0.99%), Immigrants from Singapore (5.0%, a difference of 1.1%), Iranian (5.1%, a difference of 1.4%), and Yup'ik (5.2%, a difference of 2.0%).
| Demographics | Rating | Rank | Ambulatory Disability |
| Immigrants | India | 100.0 /100 | #1 | Exceptional 4.8% |
| Filipinos | 100.0 /100 | #2 | Exceptional 4.9% |
| Thais | 100.0 /100 | #3 | Exceptional 4.9% |
| Immigrants | Taiwan | 100.0 /100 | #4 | Exceptional 4.9% |
| Immigrants | Singapore | 100.0 /100 | #5 | Exceptional 5.0% |
| Immigrants | Bolivia | 100.0 /100 | #6 | Exceptional 5.0% |
| Bolivians | 100.0 /100 | #7 | Exceptional 5.1% |
| Immigrants | South Central Asia | 100.0 /100 | #8 | Exceptional 5.1% |
| Iranians | 100.0 /100 | #9 | Exceptional 5.1% |
| Yup'ik | 100.0 /100 | #10 | Exceptional 5.2% |
| Immigrants | Korea | 100.0 /100 | #11 | Exceptional 5.2% |
| Okinawans | 100.0 /100 | #12 | Exceptional 5.3% |
| Burmese | 100.0 /100 | #13 | Exceptional 5.3% |
| Immigrants | Eastern Asia | 100.0 /100 | #14 | Exceptional 5.3% |
| Immigrants | China | 100.0 /100 | #15 | Exceptional 5.3% |
Demographics Similar to Immigrants from Venezuela by Ambulatory Disability
In terms of ambulatory disability, the demographic groups most similar to Immigrants from Venezuela are Immigrants from Turkey (5.4%, a difference of 0.020%), Immigrants from Australia (5.5%, a difference of 0.17%), Immigrants from Pakistan (5.5%, a difference of 0.29%), Immigrants from Asia (5.5%, a difference of 0.44%), and Afghan (5.5%, a difference of 0.49%).
| Demographics | Rating | Rank | Ambulatory Disability |
| Immigrants | Saudi Arabia | 100.0 /100 | #24 | Exceptional 5.4% |
| Zimbabweans | 100.0 /100 | #25 | Exceptional 5.4% |
| Immigrants | Nepal | 100.0 /100 | #26 | Exceptional 5.4% |
| Asians | 100.0 /100 | #27 | Exceptional 5.4% |
| Cambodians | 100.0 /100 | #28 | Exceptional 5.4% |
| Immigrants | Iran | 100.0 /100 | #29 | Exceptional 5.4% |
| Immigrants | Turkey | 100.0 /100 | #30 | Exceptional 5.4% |
| Immigrants | Venezuela | 100.0 /100 | #31 | Exceptional 5.4% |
| Immigrants | Australia | 100.0 /100 | #32 | Exceptional 5.5% |
| Immigrants | Pakistan | 100.0 /100 | #33 | Exceptional 5.5% |
| Immigrants | Asia | 100.0 /100 | #34 | Exceptional 5.5% |
| Afghans | 100.0 /100 | #35 | Exceptional 5.5% |
| Immigrants | Malaysia | 100.0 /100 | #36 | Exceptional 5.5% |
| Turks | 100.0 /100 | #37 | Exceptional 5.5% |
| Cypriots | 100.0 /100 | #38 | Exceptional 5.5% |