Estonian vs Scotch-Irish Self-Care Disability
COMPARE
Estonian
Scotch-Irish
Self-Care Disability
Self-Care Disability Comparison
Estonians
Scotch-Irish
2.3%
SELF-CARE DISABILITY
98.3/ 100
METRIC RATING
85th/ 347
METRIC RANK
2.6%
SELF-CARE DISABILITY
4.1/ 100
METRIC RATING
218th/ 347
METRIC RANK
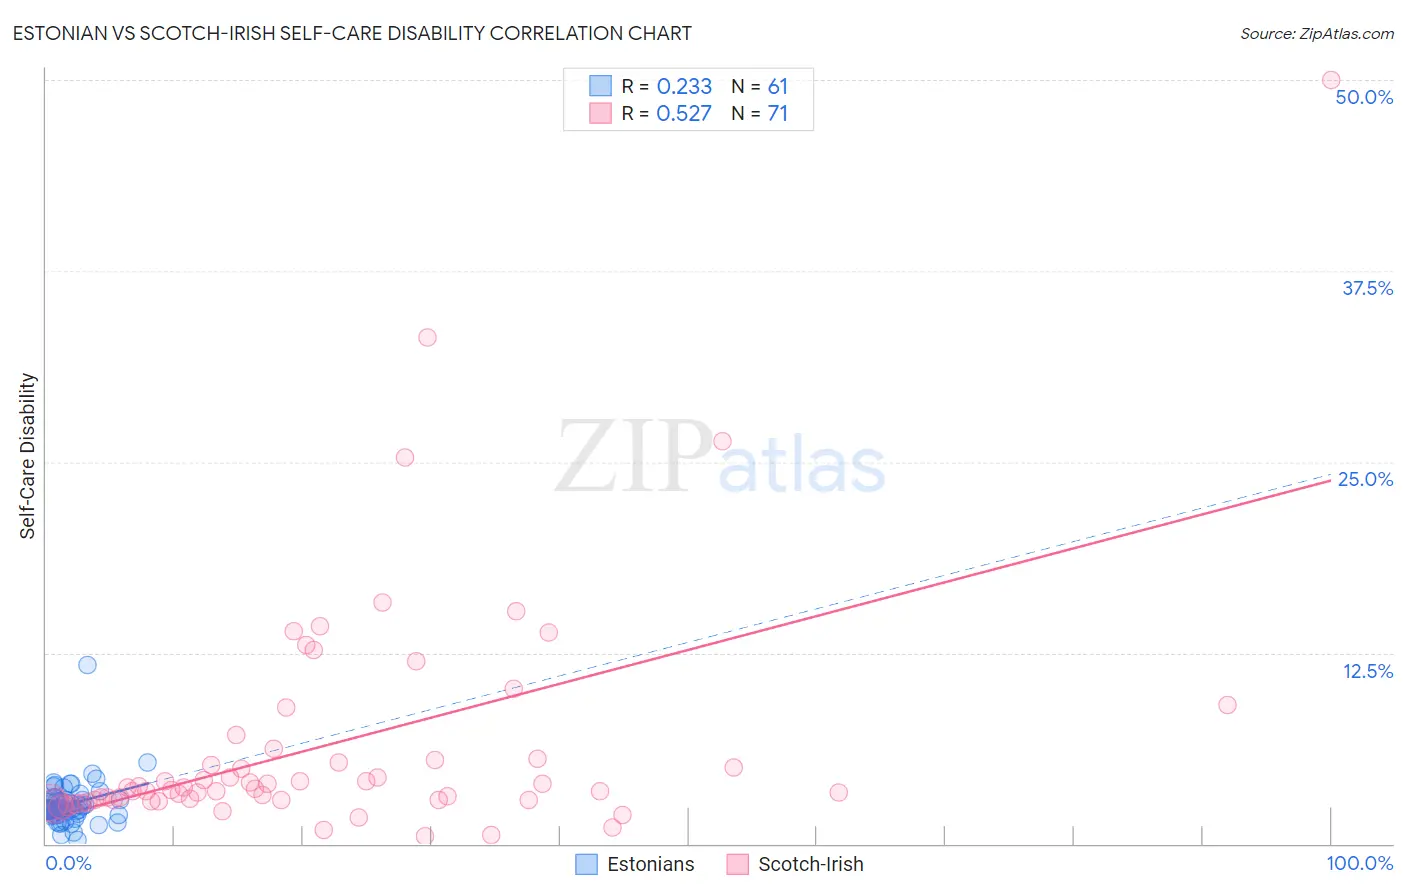
Estonian vs Scotch-Irish Self-Care Disability Correlation Chart
The statistical analysis conducted on geographies consisting of 123,478,369 people shows a weak positive correlation between the proportion of Estonians and percentage of population with self-care disability in the United States with a correlation coefficient (R) of 0.233 and weighted average of 2.3%. Similarly, the statistical analysis conducted on geographies consisting of 547,085,910 people shows a substantial positive correlation between the proportion of Scotch-Irish and percentage of population with self-care disability in the United States with a correlation coefficient (R) of 0.527 and weighted average of 2.6%, a difference of 9.0%.
Self-Care Disability Correlation Summary
| Measurement | Estonian | Scotch-Irish |
| Minimum | 0.24% | 0.47% |
| Maximum | 11.7% | 50.0% |
| Range | 11.4% | 49.5% |
| Mean | 2.6% | 6.5% |
| Median | 2.3% | 3.6% |
| Interquartile 25% (IQ1) | 1.9% | 2.8% |
| Interquartile 75% (IQ3) | 2.9% | 5.6% |
| Interquartile Range (IQR) | 0.99% | 2.7% |
| Standard Deviation (Sample) | 1.5% | 8.0% |
| Standard Deviation (Population) | 1.5% | 7.9% |
Similar Demographics by Self-Care Disability
Demographics Similar to Estonians by Self-Care Disability
In terms of self-care disability, the demographic groups most similar to Estonians are Immigrants from Northern Africa (2.3%, a difference of 0.020%), Sierra Leonean (2.4%, a difference of 0.16%), Lithuanian (2.4%, a difference of 0.16%), Immigrants from Congo (2.4%, a difference of 0.21%), and Immigrants from Spain (2.3%, a difference of 0.34%).
| Demographics | Rating | Rank | Self-Care Disability |
| Immigrants | Ireland | 99.0 /100 | #78 | Exceptional 2.3% |
| Immigrants | Kenya | 99.0 /100 | #79 | Exceptional 2.3% |
| Chileans | 98.8 /100 | #80 | Exceptional 2.3% |
| Ugandans | 98.8 /100 | #81 | Exceptional 2.3% |
| Immigrants | Denmark | 98.8 /100 | #82 | Exceptional 2.3% |
| Indians (Asian) | 98.7 /100 | #83 | Exceptional 2.3% |
| Immigrants | Spain | 98.7 /100 | #84 | Exceptional 2.3% |
| Estonians | 98.3 /100 | #85 | Exceptional 2.3% |
| Immigrants | Northern Africa | 98.2 /100 | #86 | Exceptional 2.3% |
| Sierra Leoneans | 98.0 /100 | #87 | Exceptional 2.4% |
| Lithuanians | 98.0 /100 | #88 | Exceptional 2.4% |
| Immigrants | Congo | 98.0 /100 | #89 | Exceptional 2.4% |
| Immigrants | Czechoslovakia | 97.7 /100 | #90 | Exceptional 2.4% |
| Immigrants | Jordan | 97.7 /100 | #91 | Exceptional 2.4% |
| Icelanders | 97.4 /100 | #92 | Exceptional 2.4% |
Demographics Similar to Scotch-Irish by Self-Care Disability
In terms of self-care disability, the demographic groups most similar to Scotch-Irish are Immigrants from Moldova (2.6%, a difference of 0.030%), Subsaharan African (2.6%, a difference of 0.040%), Celtic (2.6%, a difference of 0.070%), Honduran (2.6%, a difference of 0.080%), and White/Caucasian (2.6%, a difference of 0.090%).
| Demographics | Rating | Rank | Self-Care Disability |
| Native Hawaiians | 5.1 /100 | #211 | Tragic 2.6% |
| Samoans | 5.1 /100 | #212 | Tragic 2.6% |
| Ecuadorians | 4.7 /100 | #213 | Tragic 2.6% |
| Immigrants | Honduras | 4.7 /100 | #214 | Tragic 2.6% |
| Immigrants | Thailand | 4.5 /100 | #215 | Tragic 2.6% |
| Whites/Caucasians | 4.4 /100 | #216 | Tragic 2.6% |
| Celtics | 4.4 /100 | #217 | Tragic 2.6% |
| Scotch-Irish | 4.1 /100 | #218 | Tragic 2.6% |
| Immigrants | Moldova | 4.0 /100 | #219 | Tragic 2.6% |
| Sub-Saharan Africans | 4.0 /100 | #220 | Tragic 2.6% |
| Hondurans | 3.8 /100 | #221 | Tragic 2.6% |
| Spaniards | 3.8 /100 | #222 | Tragic 2.6% |
| French Canadians | 3.8 /100 | #223 | Tragic 2.6% |
| Osage | 3.6 /100 | #224 | Tragic 2.6% |
| Iraqis | 3.2 /100 | #225 | Tragic 2.6% |