Black/African American vs Scotch-Irish Unemployment Among Ages 20 to 24 years
COMPARE
Black/African American
Scotch-Irish
Unemployment Among Ages 20 to 24 years
Unemployment Among Ages 20 to 24 years Comparison
Blacks/African Americans
Scotch-Irish
12.7%
UNEMPLOYMENT AMONG AGES 20 TO 24 YEARS
0.0/ 100
METRIC RATING
314th/ 347
METRIC RANK
10.0%
UNEMPLOYMENT AMONG AGES 20 TO 24 YEARS
96.2/ 100
METRIC RATING
95th/ 347
METRIC RANK
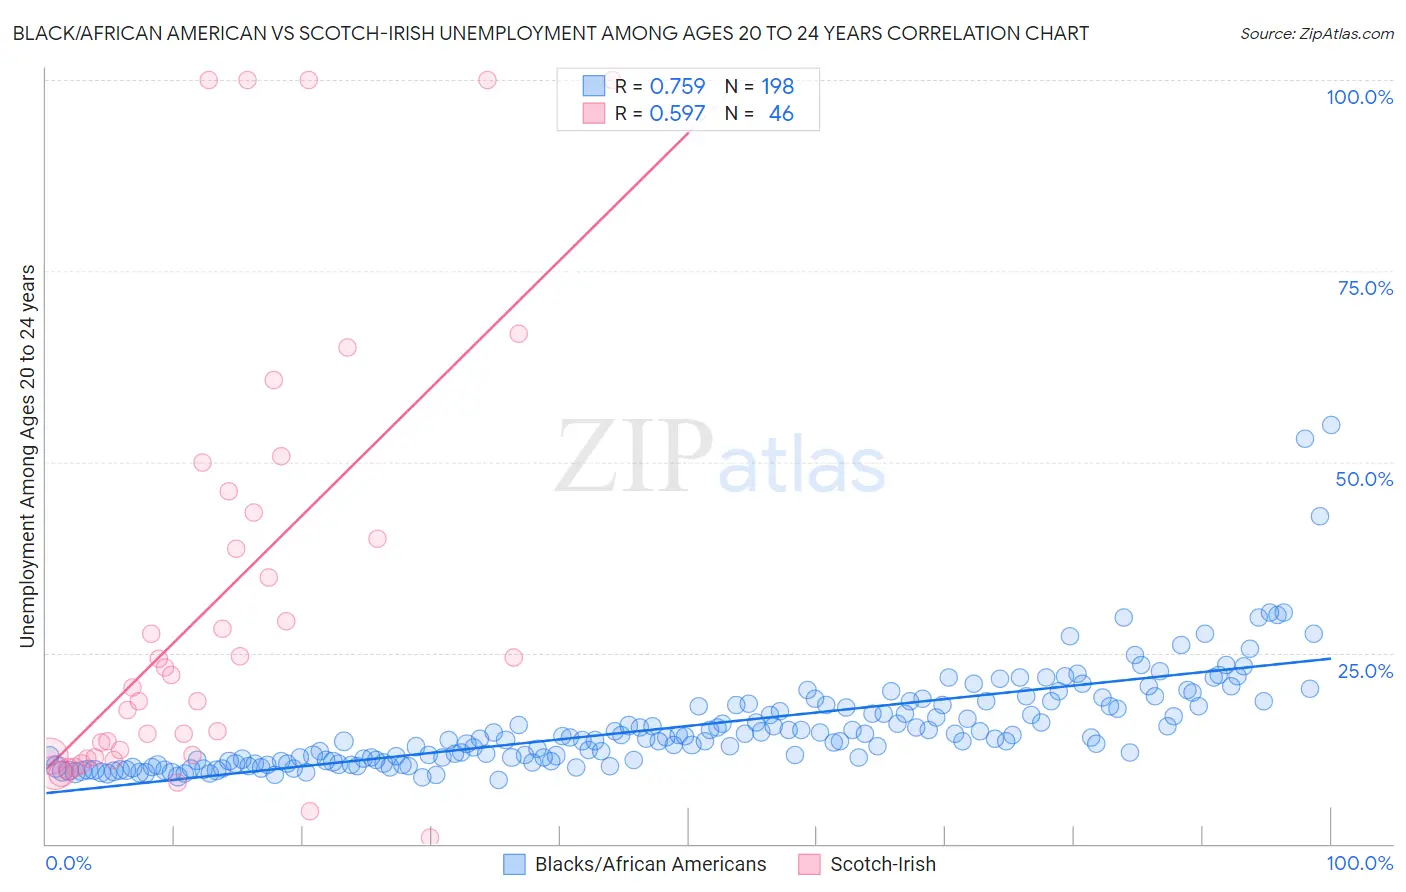
Black/African American vs Scotch-Irish Unemployment Among Ages 20 to 24 years Correlation Chart
The statistical analysis conducted on geographies consisting of 523,414,021 people shows a strong positive correlation between the proportion of Blacks/African Americans and unemployment rate among population between the ages 20 and 24 in the United States with a correlation coefficient (R) of 0.759 and weighted average of 12.7%. Similarly, the statistical analysis conducted on geographies consisting of 505,476,412 people shows a substantial positive correlation between the proportion of Scotch-Irish and unemployment rate among population between the ages 20 and 24 in the United States with a correlation coefficient (R) of 0.597 and weighted average of 10.0%, a difference of 27.3%.
Unemployment Among Ages 20 to 24 years Correlation Summary
| Measurement | Black/African American | Scotch-Irish |
| Minimum | 8.4% | 0.90% |
| Maximum | 54.7% | 100.0% |
| Range | 46.3% | 99.1% |
| Mean | 15.4% | 32.1% |
| Median | 13.7% | 21.2% |
| Interquartile 25% (IQ1) | 10.7% | 11.5% |
| Interquartile 75% (IQ3) | 18.1% | 43.4% |
| Interquartile Range (IQR) | 7.4% | 31.9% |
| Standard Deviation (Sample) | 6.7% | 28.8% |
| Standard Deviation (Population) | 6.6% | 28.5% |
Similar Demographics by Unemployment Among Ages 20 to 24 years
Demographics Similar to Blacks/African Americans by Unemployment Among Ages 20 to 24 years
In terms of unemployment among ages 20 to 24 years, the demographic groups most similar to Blacks/African Americans are Shoshone (12.7%, a difference of 0.19%), West Indian (12.8%, a difference of 0.21%), Immigrants from Dominica (12.8%, a difference of 0.68%), Houma (12.6%, a difference of 0.73%), and Immigrants from Trinidad and Tobago (12.8%, a difference of 0.80%).
| Demographics | Rating | Rank | Unemployment Among Ages 20 to 24 years |
| Bermudans | 0.0 /100 | #307 | Tragic 12.5% |
| Tohono O'odham | 0.0 /100 | #308 | Tragic 12.5% |
| Immigrants | Bangladesh | 0.0 /100 | #309 | Tragic 12.6% |
| Jamaicans | 0.0 /100 | #310 | Tragic 12.6% |
| Vietnamese | 0.0 /100 | #311 | Tragic 12.6% |
| Houma | 0.0 /100 | #312 | Tragic 12.6% |
| Shoshone | 0.0 /100 | #313 | Tragic 12.7% |
| Blacks/African Americans | 0.0 /100 | #314 | Tragic 12.7% |
| West Indians | 0.0 /100 | #315 | Tragic 12.8% |
| Immigrants | Dominica | 0.0 /100 | #316 | Tragic 12.8% |
| Immigrants | Trinidad and Tobago | 0.0 /100 | #317 | Tragic 12.8% |
| Barbadians | 0.0 /100 | #318 | Tragic 12.9% |
| Trinidadians and Tobagonians | 0.0 /100 | #319 | Tragic 12.9% |
| Cheyenne | 0.0 /100 | #320 | Tragic 13.0% |
| Immigrants | Jamaica | 0.0 /100 | #321 | Tragic 13.0% |
Demographics Similar to Scotch-Irish by Unemployment Among Ages 20 to 24 years
In terms of unemployment among ages 20 to 24 years, the demographic groups most similar to Scotch-Irish are Thai (10.0%, a difference of 0.0%), Slavic (10.0%, a difference of 0.040%), Immigrants from Micronesia (10.0%, a difference of 0.10%), Immigrants from Malaysia (10.0%, a difference of 0.19%), and Bangladeshi (10.0%, a difference of 0.20%).
| Demographics | Rating | Rank | Unemployment Among Ages 20 to 24 years |
| Poles | 97.1 /100 | #88 | Exceptional 10.0% |
| Macedonians | 97.0 /100 | #89 | Exceptional 10.0% |
| Chileans | 97.0 /100 | #90 | Exceptional 10.0% |
| Bhutanese | 96.9 /100 | #91 | Exceptional 10.0% |
| Bangladeshis | 96.9 /100 | #92 | Exceptional 10.0% |
| Immigrants | Malaysia | 96.9 /100 | #93 | Exceptional 10.0% |
| Immigrants | Micronesia | 96.6 /100 | #94 | Exceptional 10.0% |
| Scotch-Irish | 96.2 /100 | #95 | Exceptional 10.0% |
| Thais | 96.2 /100 | #96 | Exceptional 10.0% |
| Slavs | 96.1 /100 | #97 | Exceptional 10.0% |
| Japanese | 95.4 /100 | #98 | Exceptional 10.0% |
| Fijians | 95.3 /100 | #99 | Exceptional 10.0% |
| Immigrants | France | 95.2 /100 | #100 | Exceptional 10.0% |
| Laotians | 95.1 /100 | #101 | Exceptional 10.0% |
| Immigrants | Argentina | 94.9 /100 | #102 | Exceptional 10.0% |