African vs Immigrants from Portugal Cognitive Disability
COMPARE
African
Immigrants from Portugal
Cognitive Disability
Cognitive Disability Comparison
Africans
Immigrants from Portugal
18.6%
COGNITIVE DISABILITY
0.0/ 100
METRIC RATING
321st/ 347
METRIC RANK
17.2%
COGNITIVE DISABILITY
61.8/ 100
METRIC RATING
169th/ 347
METRIC RANK
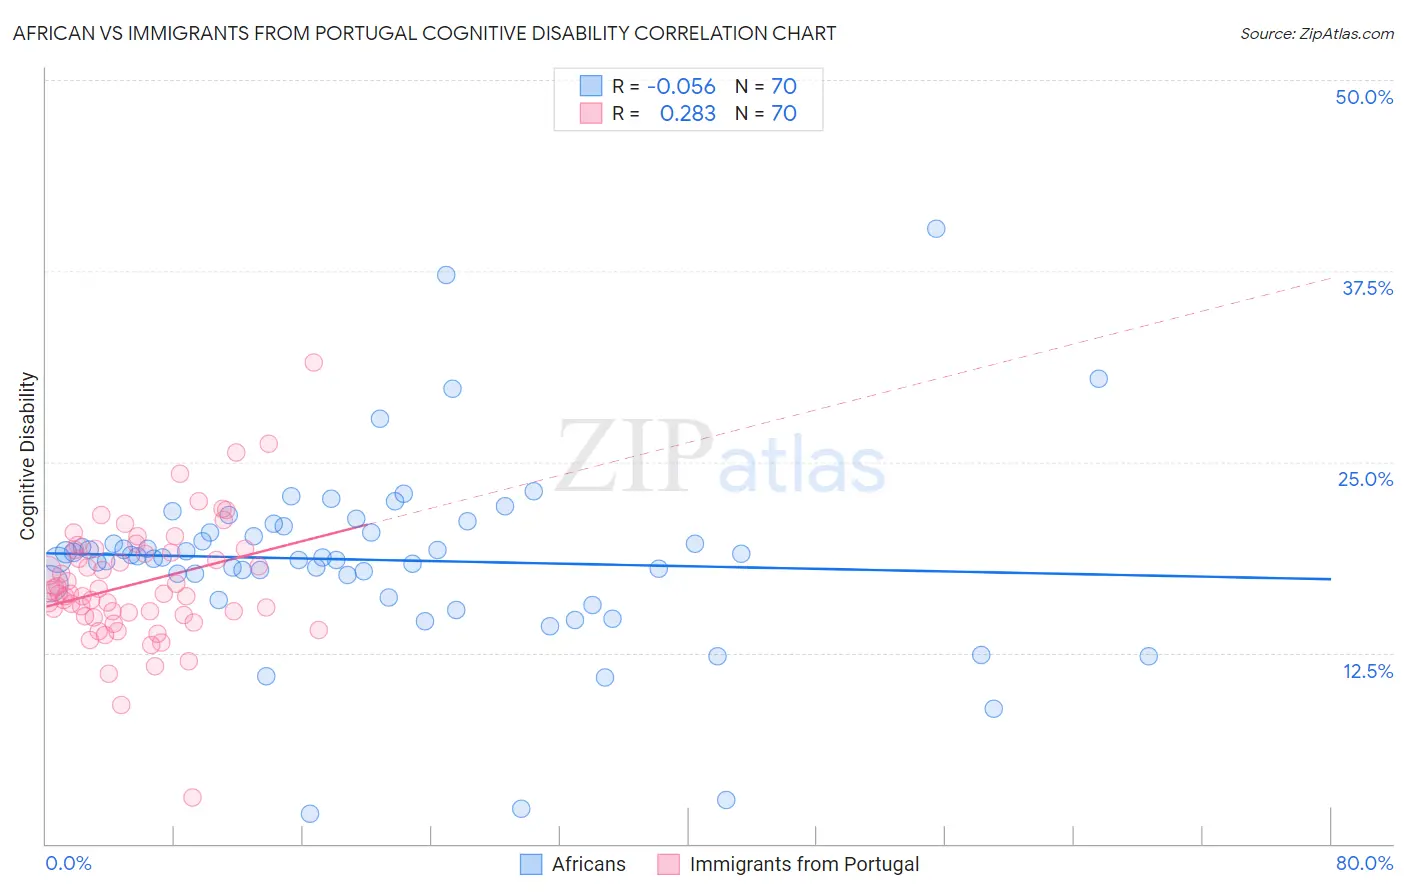
African vs Immigrants from Portugal Cognitive Disability Correlation Chart
The statistical analysis conducted on geographies consisting of 469,983,328 people shows a slight negative correlation between the proportion of Africans and percentage of population with cognitive disability in the United States with a correlation coefficient (R) of -0.056 and weighted average of 18.6%. Similarly, the statistical analysis conducted on geographies consisting of 174,785,813 people shows a weak positive correlation between the proportion of Immigrants from Portugal and percentage of population with cognitive disability in the United States with a correlation coefficient (R) of 0.283 and weighted average of 17.2%, a difference of 8.3%.
Cognitive Disability Correlation Summary
| Measurement | African | Immigrants from Portugal |
| Minimum | 2.0% | 3.0% |
| Maximum | 40.3% | 31.5% |
| Range | 38.3% | 28.5% |
| Mean | 18.6% | 17.0% |
| Median | 18.8% | 16.4% |
| Interquartile 25% (IQ1) | 17.0% | 15.0% |
| Interquartile 75% (IQ3) | 20.4% | 19.2% |
| Interquartile Range (IQR) | 3.4% | 4.3% |
| Standard Deviation (Sample) | 6.1% | 4.0% |
| Standard Deviation (Population) | 6.0% | 4.0% |
Similar Demographics by Cognitive Disability
Demographics Similar to Africans by Cognitive Disability
In terms of cognitive disability, the demographic groups most similar to Africans are Immigrants from Liberia (18.7%, a difference of 0.060%), Pueblo (18.7%, a difference of 0.080%), Apache (18.6%, a difference of 0.090%), Comanche (18.6%, a difference of 0.13%), and Bangladeshi (18.6%, a difference of 0.17%).
| Demographics | Rating | Rank | Cognitive Disability |
| Sub-Saharan Africans | 0.0 /100 | #314 | Tragic 18.5% |
| Immigrants | Dominica | 0.0 /100 | #315 | Tragic 18.6% |
| Immigrants | Middle Africa | 0.0 /100 | #316 | Tragic 18.6% |
| Liberians | 0.0 /100 | #317 | Tragic 18.6% |
| Bangladeshis | 0.0 /100 | #318 | Tragic 18.6% |
| Comanche | 0.0 /100 | #319 | Tragic 18.6% |
| Apache | 0.0 /100 | #320 | Tragic 18.6% |
| Africans | 0.0 /100 | #321 | Tragic 18.6% |
| Immigrants | Liberia | 0.0 /100 | #322 | Tragic 18.7% |
| Pueblo | 0.0 /100 | #323 | Tragic 18.7% |
| Dominicans | 0.0 /100 | #324 | Tragic 18.7% |
| Indonesians | 0.0 /100 | #325 | Tragic 18.7% |
| Immigrants | Senegal | 0.0 /100 | #326 | Tragic 18.7% |
| U.S. Virgin Islanders | 0.0 /100 | #327 | Tragic 18.7% |
| Kiowa | 0.0 /100 | #328 | Tragic 18.7% |
Demographics Similar to Immigrants from Portugal by Cognitive Disability
In terms of cognitive disability, the demographic groups most similar to Immigrants from Portugal are Immigrants (17.2%, a difference of 0.020%), Immigrants from Syria (17.2%, a difference of 0.050%), Ecuadorian (17.2%, a difference of 0.070%), Tlingit-Haida (17.2%, a difference of 0.070%), and Immigrants from Ecuador (17.2%, a difference of 0.080%).
| Demographics | Rating | Rank | Cognitive Disability |
| Yugoslavians | 71.6 /100 | #162 | Good 17.2% |
| Immigrants | Switzerland | 71.5 /100 | #163 | Good 17.2% |
| Armenians | 70.1 /100 | #164 | Good 17.2% |
| Immigrants | Albania | 64.9 /100 | #165 | Good 17.2% |
| Immigrants | Ecuador | 64.4 /100 | #166 | Good 17.2% |
| Immigrants | Syria | 63.5 /100 | #167 | Good 17.2% |
| Immigrants | Immigrants | 62.5 /100 | #168 | Good 17.2% |
| Immigrants | Portugal | 61.8 /100 | #169 | Good 17.2% |
| Ecuadorians | 59.6 /100 | #170 | Average 17.2% |
| Tlingit-Haida | 59.4 /100 | #171 | Average 17.2% |
| Immigrants | Turkey | 56.7 /100 | #172 | Average 17.2% |
| Immigrants | Northern Africa | 50.2 /100 | #173 | Average 17.3% |
| Laotians | 50.0 /100 | #174 | Average 17.3% |
| Tsimshian | 49.8 /100 | #175 | Average 17.3% |
| Shoshone | 49.2 /100 | #176 | Average 17.3% |