Guatemalan vs Immigrants from Portugal Cognitive Disability
COMPARE
Guatemalan
Immigrants from Portugal
Cognitive Disability
Cognitive Disability Comparison
Guatemalans
Immigrants from Portugal
17.8%
COGNITIVE DISABILITY
2.1/ 100
METRIC RATING
231st/ 347
METRIC RANK
17.2%
COGNITIVE DISABILITY
61.8/ 100
METRIC RATING
169th/ 347
METRIC RANK
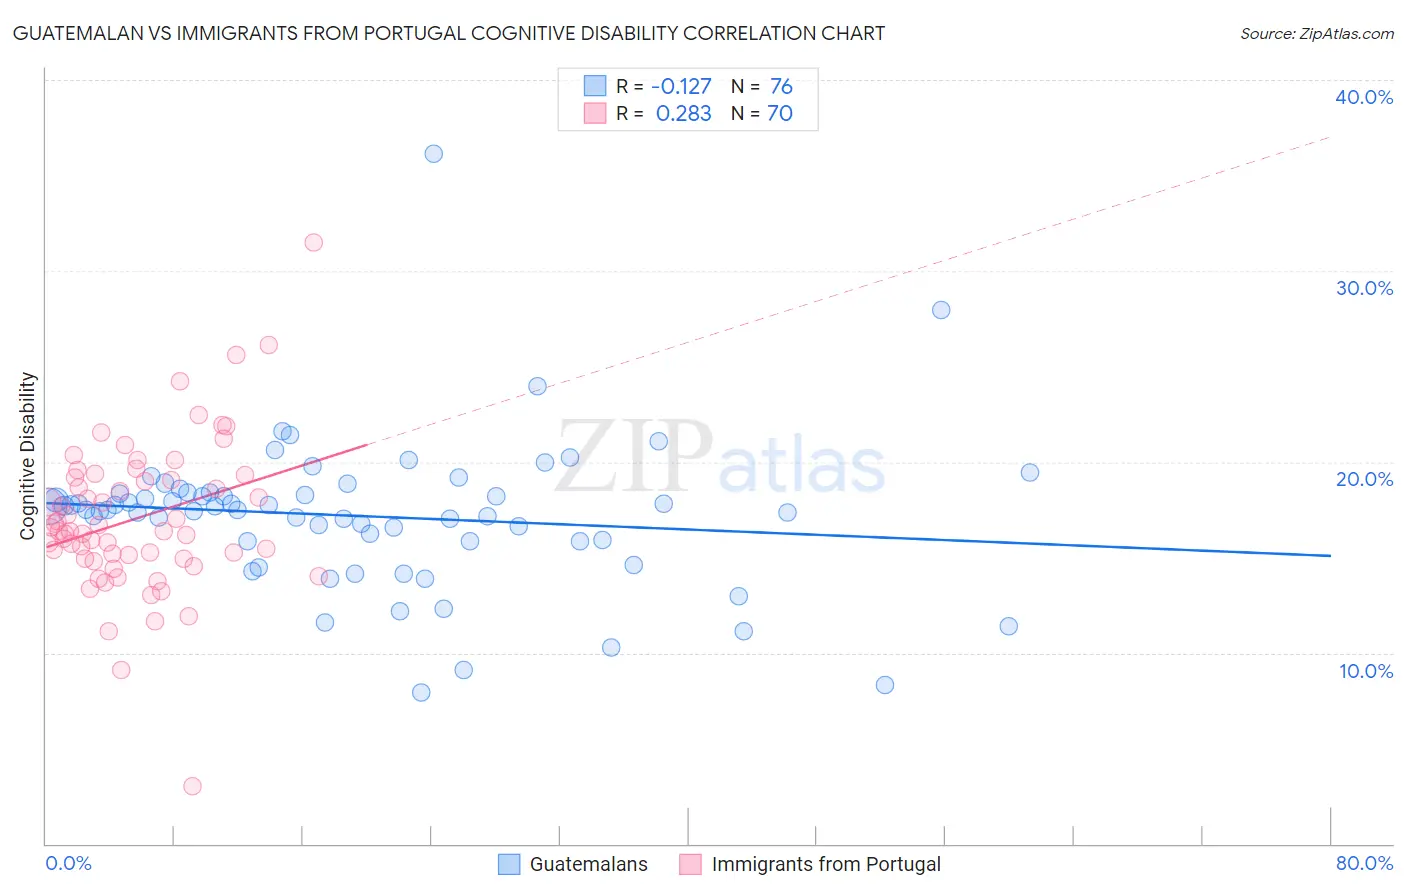
Guatemalan vs Immigrants from Portugal Cognitive Disability Correlation Chart
The statistical analysis conducted on geographies consisting of 409,490,798 people shows a poor negative correlation between the proportion of Guatemalans and percentage of population with cognitive disability in the United States with a correlation coefficient (R) of -0.127 and weighted average of 17.8%. Similarly, the statistical analysis conducted on geographies consisting of 174,785,813 people shows a weak positive correlation between the proportion of Immigrants from Portugal and percentage of population with cognitive disability in the United States with a correlation coefficient (R) of 0.283 and weighted average of 17.2%, a difference of 3.1%.
Cognitive Disability Correlation Summary
| Measurement | Guatemalan | Immigrants from Portugal |
| Minimum | 7.9% | 3.0% |
| Maximum | 36.1% | 31.5% |
| Range | 28.2% | 28.5% |
| Mean | 17.2% | 17.0% |
| Median | 17.5% | 16.4% |
| Interquartile 25% (IQ1) | 15.9% | 15.0% |
| Interquartile 75% (IQ3) | 18.4% | 19.2% |
| Interquartile Range (IQR) | 2.5% | 4.3% |
| Standard Deviation (Sample) | 3.9% | 4.0% |
| Standard Deviation (Population) | 3.9% | 4.0% |
Similar Demographics by Cognitive Disability
Demographics Similar to Guatemalans by Cognitive Disability
In terms of cognitive disability, the demographic groups most similar to Guatemalans are Tongan (17.8%, a difference of 0.0%), Panamanian (17.8%, a difference of 0.0%), Osage (17.8%, a difference of 0.020%), Spanish American Indian (17.8%, a difference of 0.020%), and Mongolian (17.7%, a difference of 0.030%).
| Demographics | Rating | Rank | Cognitive Disability |
| Fijians | 3.4 /100 | #224 | Tragic 17.7% |
| Vietnamese | 3.4 /100 | #225 | Tragic 17.7% |
| Marshallese | 2.7 /100 | #226 | Tragic 17.7% |
| Immigrants | St. Vincent and the Grenadines | 2.6 /100 | #227 | Tragic 17.7% |
| Immigrants | Central America | 2.3 /100 | #228 | Tragic 17.7% |
| Immigrants | Guatemala | 2.2 /100 | #229 | Tragic 17.7% |
| Mongolians | 2.2 /100 | #230 | Tragic 17.7% |
| Guatemalans | 2.1 /100 | #231 | Tragic 17.8% |
| Tongans | 2.1 /100 | #232 | Tragic 17.8% |
| Panamanians | 2.1 /100 | #233 | Tragic 17.8% |
| Osage | 2.0 /100 | #234 | Tragic 17.8% |
| Spanish American Indians | 2.0 /100 | #235 | Tragic 17.8% |
| Immigrants | Iraq | 1.8 /100 | #236 | Tragic 17.8% |
| Immigrants | Mexico | 1.8 /100 | #237 | Tragic 17.8% |
| Cheyenne | 1.7 /100 | #238 | Tragic 17.8% |
Demographics Similar to Immigrants from Portugal by Cognitive Disability
In terms of cognitive disability, the demographic groups most similar to Immigrants from Portugal are Immigrants (17.2%, a difference of 0.020%), Immigrants from Syria (17.2%, a difference of 0.050%), Ecuadorian (17.2%, a difference of 0.070%), Tlingit-Haida (17.2%, a difference of 0.070%), and Immigrants from Ecuador (17.2%, a difference of 0.080%).
| Demographics | Rating | Rank | Cognitive Disability |
| Yugoslavians | 71.6 /100 | #162 | Good 17.2% |
| Immigrants | Switzerland | 71.5 /100 | #163 | Good 17.2% |
| Armenians | 70.1 /100 | #164 | Good 17.2% |
| Immigrants | Albania | 64.9 /100 | #165 | Good 17.2% |
| Immigrants | Ecuador | 64.4 /100 | #166 | Good 17.2% |
| Immigrants | Syria | 63.5 /100 | #167 | Good 17.2% |
| Immigrants | Immigrants | 62.5 /100 | #168 | Good 17.2% |
| Immigrants | Portugal | 61.8 /100 | #169 | Good 17.2% |
| Ecuadorians | 59.6 /100 | #170 | Average 17.2% |
| Tlingit-Haida | 59.4 /100 | #171 | Average 17.2% |
| Immigrants | Turkey | 56.7 /100 | #172 | Average 17.2% |
| Immigrants | Northern Africa | 50.2 /100 | #173 | Average 17.3% |
| Laotians | 50.0 /100 | #174 | Average 17.3% |
| Tsimshian | 49.8 /100 | #175 | Average 17.3% |
| Shoshone | 49.2 /100 | #176 | Average 17.3% |