Immigrants from Netherlands vs Immigrants from Philippines Hearing Disability
COMPARE
Immigrants from Netherlands
Immigrants from Philippines
Hearing Disability
Hearing Disability Comparison
Immigrants from Netherlands
Immigrants from Philippines
3.3%
HEARING DISABILITY
1.1/ 100
METRIC RATING
240th/ 347
METRIC RANK
3.0%
HEARING DISABILITY
46.4/ 100
METRIC RATING
177th/ 347
METRIC RANK
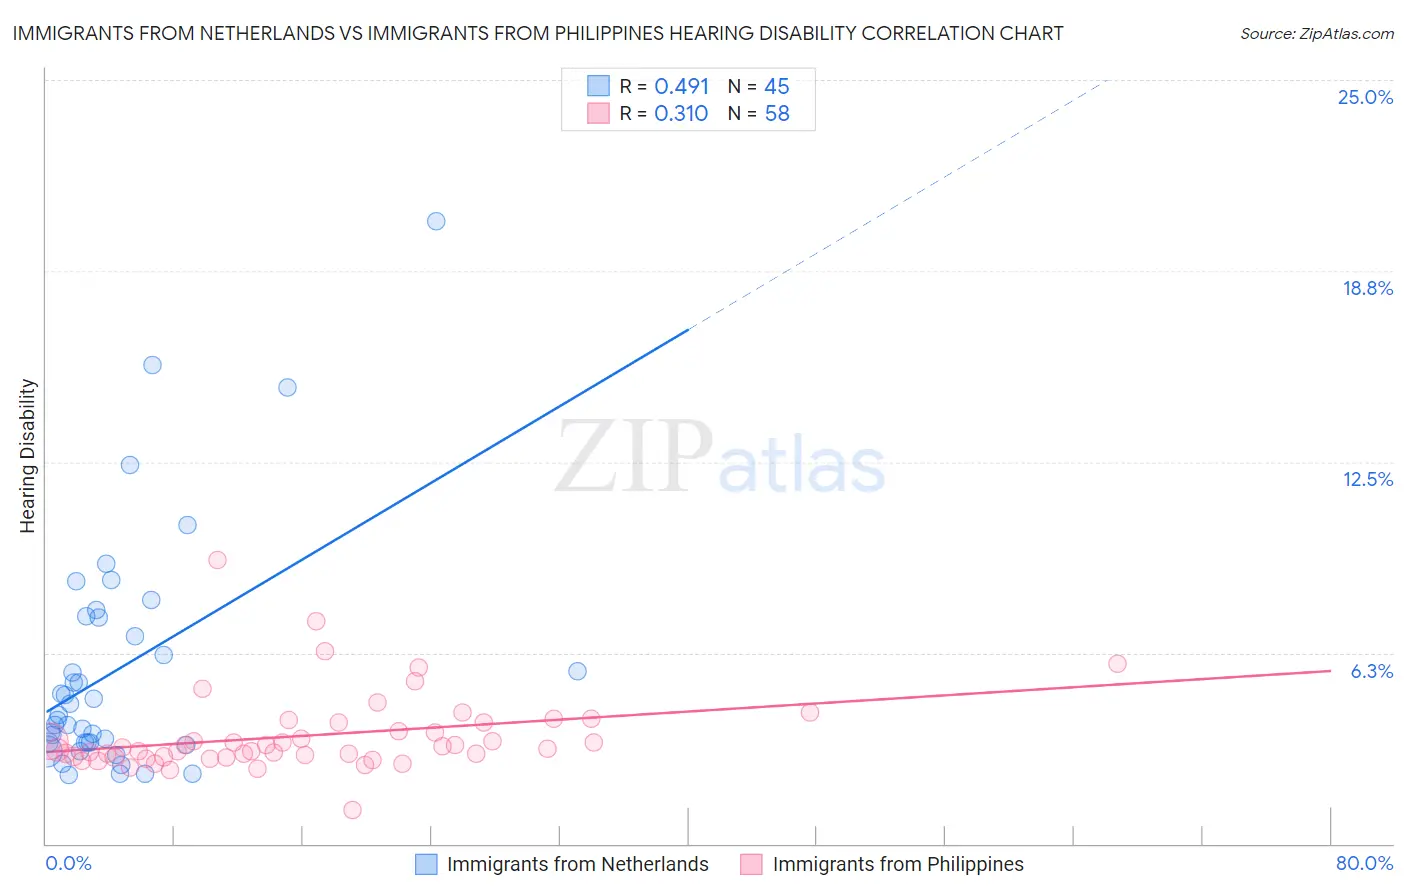
Immigrants from Netherlands vs Immigrants from Philippines Hearing Disability Correlation Chart
The statistical analysis conducted on geographies consisting of 237,853,036 people shows a moderate positive correlation between the proportion of Immigrants from Netherlands and percentage of population with hearing disability in the United States with a correlation coefficient (R) of 0.491 and weighted average of 3.3%. Similarly, the statistical analysis conducted on geographies consisting of 471,004,648 people shows a mild positive correlation between the proportion of Immigrants from Philippines and percentage of population with hearing disability in the United States with a correlation coefficient (R) of 0.310 and weighted average of 3.0%, a difference of 10.1%.
Hearing Disability Correlation Summary
| Measurement | Immigrants from Netherlands | Immigrants from Philippines |
| Minimum | 2.3% | 1.1% |
| Maximum | 20.4% | 9.3% |
| Range | 18.1% | 8.2% |
| Mean | 5.7% | 3.5% |
| Median | 4.2% | 3.1% |
| Interquartile 25% (IQ1) | 3.3% | 2.8% |
| Interquartile 75% (IQ3) | 7.4% | 4.0% |
| Interquartile Range (IQR) | 4.1% | 1.1% |
| Standard Deviation (Sample) | 3.9% | 1.3% |
| Standard Deviation (Population) | 3.9% | 1.3% |
Similar Demographics by Hearing Disability
Demographics Similar to Immigrants from Netherlands by Hearing Disability
In terms of hearing disability, the demographic groups most similar to Immigrants from Netherlands are Samoan (3.3%, a difference of 0.070%), Nepalese (3.3%, a difference of 0.18%), Yugoslavian (3.3%, a difference of 0.18%), Immigrants from Western Europe (3.3%, a difference of 0.35%), and Assyrian/Chaldean/Syriac (3.3%, a difference of 0.43%).
| Demographics | Rating | Rank | Hearing Disability |
| Estonians | 2.4 /100 | #233 | Tragic 3.3% |
| Central American Indians | 2.3 /100 | #234 | Tragic 3.3% |
| Guamanians/Chamorros | 2.2 /100 | #235 | Tragic 3.3% |
| Serbians | 2.2 /100 | #236 | Tragic 3.3% |
| Immigrants | Austria | 1.8 /100 | #237 | Tragic 3.3% |
| German Russians | 1.8 /100 | #238 | Tragic 3.3% |
| Nepalese | 1.2 /100 | #239 | Tragic 3.3% |
| Immigrants | Netherlands | 1.1 /100 | #240 | Tragic 3.3% |
| Samoans | 1.1 /100 | #241 | Tragic 3.3% |
| Yugoslavians | 1.0 /100 | #242 | Tragic 3.3% |
| Immigrants | Western Europe | 1.0 /100 | #243 | Tragic 3.3% |
| Assyrians/Chaldeans/Syriacs | 0.9 /100 | #244 | Tragic 3.3% |
| Immigrants | Scotland | 0.8 /100 | #245 | Tragic 3.3% |
| Immigrants | England | 0.7 /100 | #246 | Tragic 3.3% |
| Lithuanians | 0.6 /100 | #247 | Tragic 3.4% |
Demographics Similar to Immigrants from Philippines by Hearing Disability
In terms of hearing disability, the demographic groups most similar to Immigrants from Philippines are Japanese (3.0%, a difference of 0.040%), Panamanian (3.0%, a difference of 0.060%), Immigrants from Romania (3.0%, a difference of 0.20%), Immigrants from Moldova (3.0%, a difference of 0.31%), and Indonesian (3.0%, a difference of 0.34%).
| Demographics | Rating | Rank | Hearing Disability |
| Immigrants | Cabo Verde | 56.9 /100 | #170 | Average 3.0% |
| Immigrants | Ukraine | 56.6 /100 | #171 | Average 3.0% |
| Armenians | 56.0 /100 | #172 | Average 3.0% |
| Immigrants | Serbia | 51.1 /100 | #173 | Average 3.0% |
| Indonesians | 50.0 /100 | #174 | Average 3.0% |
| Immigrants | Romania | 48.4 /100 | #175 | Average 3.0% |
| Panamanians | 47.0 /100 | #176 | Average 3.0% |
| Immigrants | Philippines | 46.4 /100 | #177 | Average 3.0% |
| Japanese | 46.0 /100 | #178 | Average 3.0% |
| Immigrants | Moldova | 43.1 /100 | #179 | Average 3.0% |
| Immigrants | Sweden | 42.4 /100 | #180 | Average 3.0% |
| Immigrants | Belgium | 41.5 /100 | #181 | Average 3.0% |
| Immigrants | Italy | 41.1 /100 | #182 | Average 3.0% |
| Bulgarians | 39.7 /100 | #183 | Fair 3.0% |
| Immigrants | Ireland | 37.4 /100 | #184 | Fair 3.0% |