Immigrants from Vietnam vs Immigrants from Philippines Hearing Disability
COMPARE
Immigrants from Vietnam
Immigrants from Philippines
Hearing Disability
Hearing Disability Comparison
Immigrants from Vietnam
Immigrants from Philippines
2.9%
HEARING DISABILITY
86.5/ 100
METRIC RATING
130th/ 347
METRIC RANK
3.0%
HEARING DISABILITY
46.4/ 100
METRIC RATING
177th/ 347
METRIC RANK
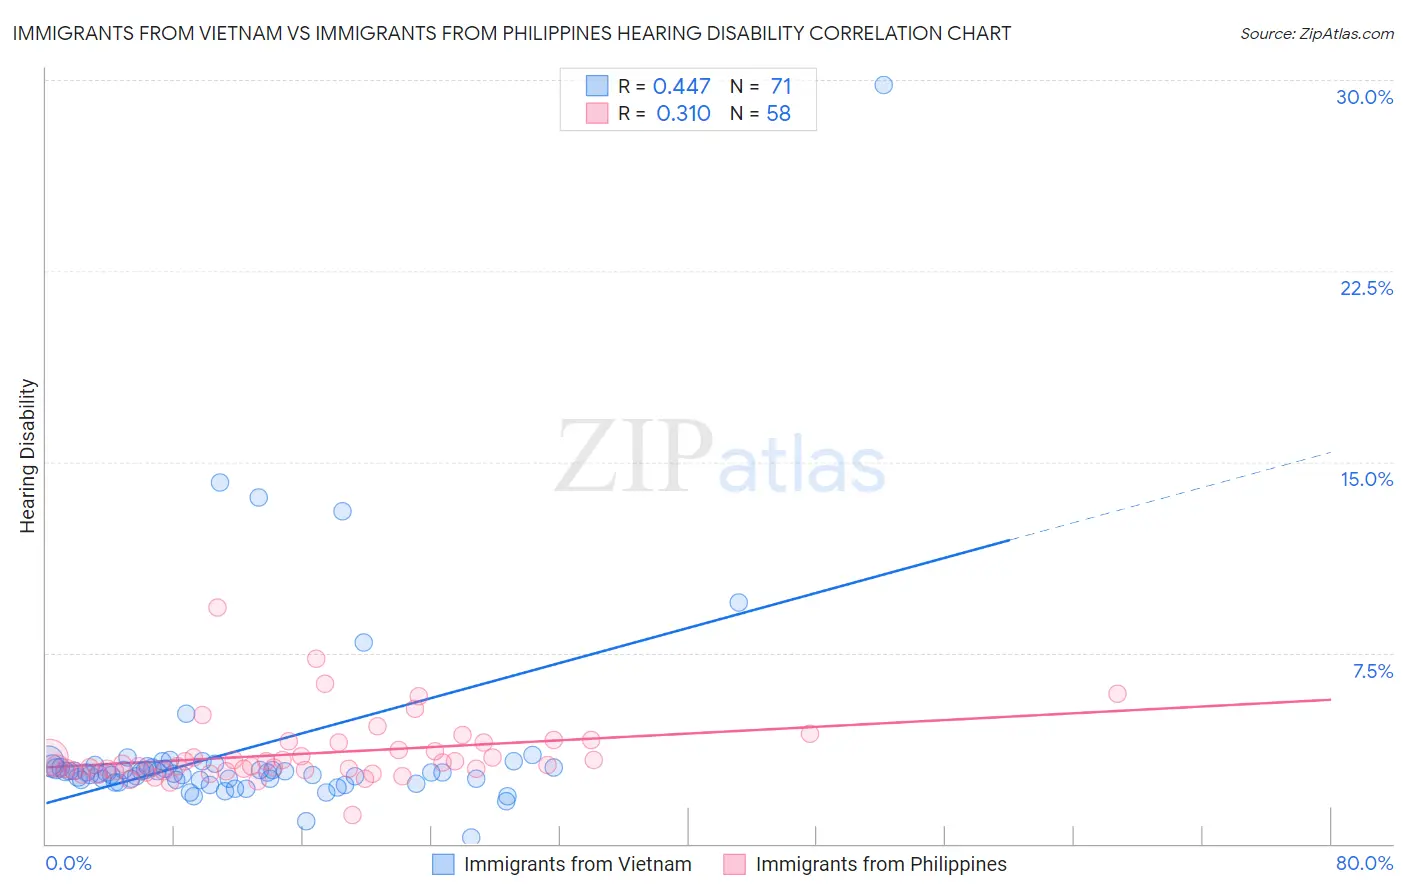
Immigrants from Vietnam vs Immigrants from Philippines Hearing Disability Correlation Chart
The statistical analysis conducted on geographies consisting of 404,662,958 people shows a moderate positive correlation between the proportion of Immigrants from Vietnam and percentage of population with hearing disability in the United States with a correlation coefficient (R) of 0.447 and weighted average of 2.9%. Similarly, the statistical analysis conducted on geographies consisting of 471,004,648 people shows a mild positive correlation between the proportion of Immigrants from Philippines and percentage of population with hearing disability in the United States with a correlation coefficient (R) of 0.310 and weighted average of 3.0%, a difference of 4.9%.
Hearing Disability Correlation Summary
| Measurement | Immigrants from Vietnam | Immigrants from Philippines |
| Minimum | 0.23% | 1.1% |
| Maximum | 29.8% | 9.3% |
| Range | 29.6% | 8.2% |
| Mean | 3.7% | 3.5% |
| Median | 2.8% | 3.1% |
| Interquartile 25% (IQ1) | 2.5% | 2.8% |
| Interquartile 75% (IQ3) | 3.0% | 4.0% |
| Interquartile Range (IQR) | 0.53% | 1.1% |
| Standard Deviation (Sample) | 4.0% | 1.3% |
| Standard Deviation (Population) | 4.0% | 1.3% |
Similar Demographics by Hearing Disability
Demographics Similar to Immigrants from Vietnam by Hearing Disability
In terms of hearing disability, the demographic groups most similar to Immigrants from Vietnam are Immigrants from Uganda (2.9%, a difference of 0.020%), South American Indian (2.9%, a difference of 0.070%), Immigrants from Western Asia (2.9%, a difference of 0.070%), Immigrants from Kenya (2.9%, a difference of 0.090%), and Chilean (2.9%, a difference of 0.14%).
| Demographics | Rating | Rank | Hearing Disability |
| Immigrants | Zaire | 88.6 /100 | #123 | Excellent 2.9% |
| Bahamians | 88.6 /100 | #124 | Excellent 2.9% |
| Immigrants | Albania | 88.5 /100 | #125 | Excellent 2.9% |
| Immigrants | Sudan | 87.8 /100 | #126 | Excellent 2.9% |
| South American Indians | 86.9 /100 | #127 | Excellent 2.9% |
| Immigrants | Western Asia | 86.9 /100 | #128 | Excellent 2.9% |
| Immigrants | Uganda | 86.6 /100 | #129 | Excellent 2.9% |
| Immigrants | Vietnam | 86.5 /100 | #130 | Excellent 2.9% |
| Immigrants | Kenya | 86.1 /100 | #131 | Excellent 2.9% |
| Chileans | 85.8 /100 | #132 | Excellent 2.9% |
| Immigrants | Syria | 85.8 /100 | #133 | Excellent 2.9% |
| Ugandans | 85.5 /100 | #134 | Excellent 2.9% |
| Soviet Union | 84.8 /100 | #135 | Excellent 2.9% |
| Immigrants | Brazil | 84.6 /100 | #136 | Excellent 2.9% |
| Sri Lankans | 84.1 /100 | #137 | Excellent 2.9% |
Demographics Similar to Immigrants from Philippines by Hearing Disability
In terms of hearing disability, the demographic groups most similar to Immigrants from Philippines are Japanese (3.0%, a difference of 0.040%), Panamanian (3.0%, a difference of 0.060%), Immigrants from Romania (3.0%, a difference of 0.20%), Immigrants from Moldova (3.0%, a difference of 0.31%), and Indonesian (3.0%, a difference of 0.34%).
| Demographics | Rating | Rank | Hearing Disability |
| Immigrants | Cabo Verde | 56.9 /100 | #170 | Average 3.0% |
| Immigrants | Ukraine | 56.6 /100 | #171 | Average 3.0% |
| Armenians | 56.0 /100 | #172 | Average 3.0% |
| Immigrants | Serbia | 51.1 /100 | #173 | Average 3.0% |
| Indonesians | 50.0 /100 | #174 | Average 3.0% |
| Immigrants | Romania | 48.4 /100 | #175 | Average 3.0% |
| Panamanians | 47.0 /100 | #176 | Average 3.0% |
| Immigrants | Philippines | 46.4 /100 | #177 | Average 3.0% |
| Japanese | 46.0 /100 | #178 | Average 3.0% |
| Immigrants | Moldova | 43.1 /100 | #179 | Average 3.0% |
| Immigrants | Sweden | 42.4 /100 | #180 | Average 3.0% |
| Immigrants | Belgium | 41.5 /100 | #181 | Average 3.0% |
| Immigrants | Italy | 41.1 /100 | #182 | Average 3.0% |
| Bulgarians | 39.7 /100 | #183 | Fair 3.0% |
| Immigrants | Ireland | 37.4 /100 | #184 | Fair 3.0% |