Blackfeet vs Immigrants from Philippines Female Unemployment
COMPARE
Blackfeet
Immigrants from Philippines
Female Unemployment
Female Unemployment Comparison
Blackfeet
Immigrants from Philippines
5.9%
FEMALE UNEMPLOYMENT
0.0/ 100
METRIC RATING
265th/ 347
METRIC RANK
5.5%
FEMALE UNEMPLOYMENT
5.3/ 100
METRIC RATING
227th/ 347
METRIC RANK
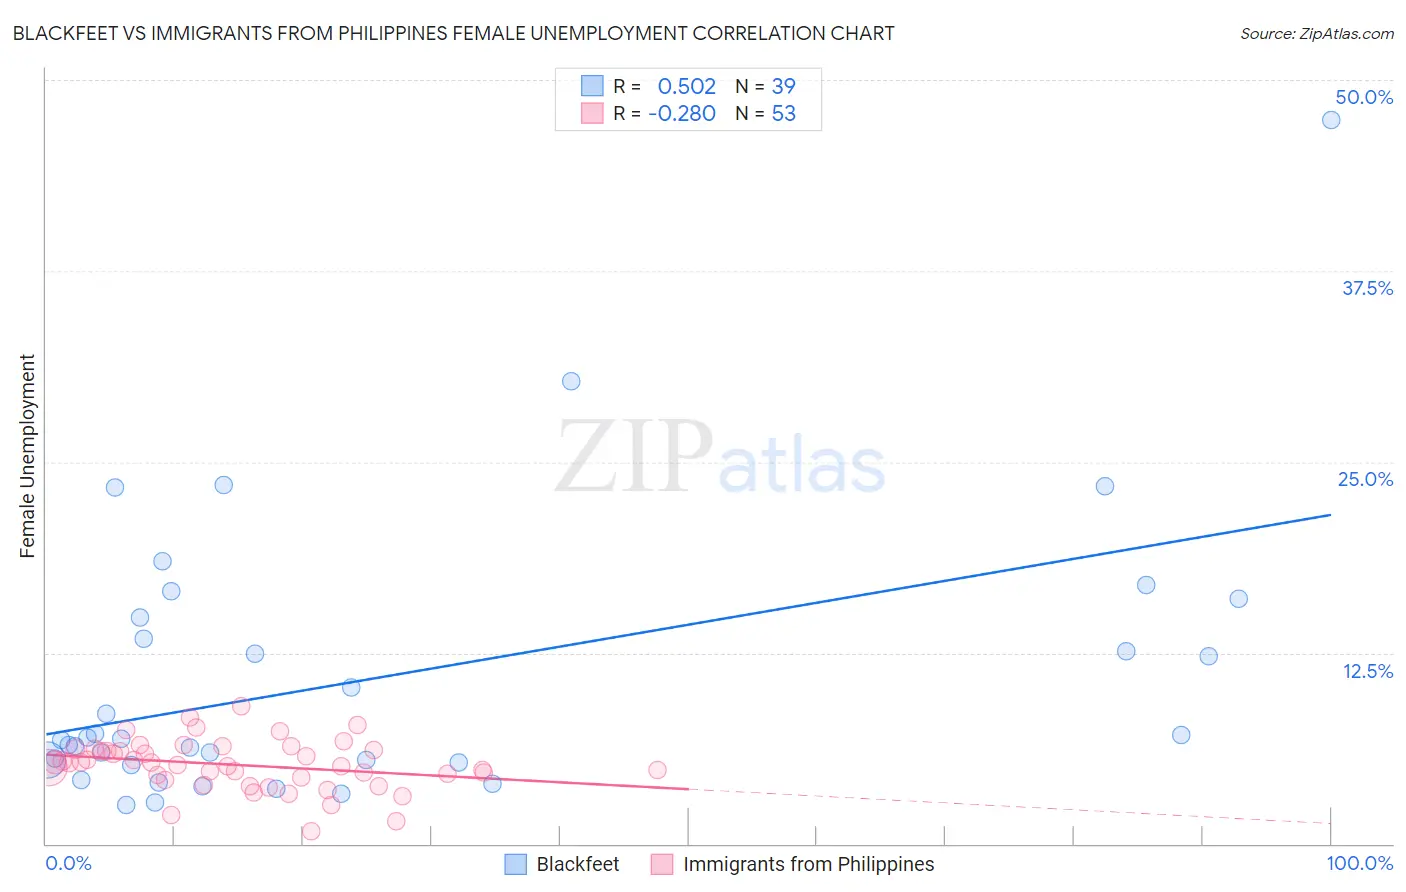
Blackfeet vs Immigrants from Philippines Female Unemployment Correlation Chart
The statistical analysis conducted on geographies consisting of 308,006,110 people shows a substantial positive correlation between the proportion of Blackfeet and unemploymnet rate among females in the United States with a correlation coefficient (R) of 0.502 and weighted average of 5.9%. Similarly, the statistical analysis conducted on geographies consisting of 468,047,266 people shows a weak negative correlation between the proportion of Immigrants from Philippines and unemploymnet rate among females in the United States with a correlation coefficient (R) of -0.280 and weighted average of 5.5%, a difference of 6.9%.
Female Unemployment Correlation Summary
| Measurement | Blackfeet | Immigrants from Philippines |
| Minimum | 2.5% | 0.80% |
| Maximum | 47.4% | 9.0% |
| Range | 44.9% | 8.2% |
| Mean | 10.8% | 5.2% |
| Median | 6.9% | 5.3% |
| Interquartile 25% (IQ1) | 5.3% | 4.2% |
| Interquartile 75% (IQ3) | 14.8% | 6.2% |
| Interquartile Range (IQR) | 9.5% | 1.9% |
| Standard Deviation (Sample) | 9.1% | 1.6% |
| Standard Deviation (Population) | 9.0% | 1.6% |
Similar Demographics by Female Unemployment
Demographics Similar to Blackfeet by Female Unemployment
In terms of female unemployment, the demographic groups most similar to Blackfeet are Cape Verdean (5.9%, a difference of 0.28%), Nepalese (5.9%, a difference of 0.39%), Immigrants from Bahamas (5.8%, a difference of 0.40%), Honduran (5.9%, a difference of 0.48%), and Immigrants from Western Africa (5.9%, a difference of 0.69%).
| Demographics | Rating | Rank | Female Unemployment |
| Immigrants | Portugal | 0.2 /100 | #258 | Tragic 5.8% |
| Immigrants | Fiji | 0.2 /100 | #259 | Tragic 5.8% |
| Nigerians | 0.2 /100 | #260 | Tragic 5.8% |
| Kiowa | 0.1 /100 | #261 | Tragic 5.8% |
| Immigrants | Nigeria | 0.1 /100 | #262 | Tragic 5.8% |
| Immigrants | Azores | 0.1 /100 | #263 | Tragic 5.8% |
| Immigrants | Bahamas | 0.1 /100 | #264 | Tragic 5.8% |
| Blackfeet | 0.0 /100 | #265 | Tragic 5.9% |
| Cape Verdeans | 0.0 /100 | #266 | Tragic 5.9% |
| Nepalese | 0.0 /100 | #267 | Tragic 5.9% |
| Hondurans | 0.0 /100 | #268 | Tragic 5.9% |
| Immigrants | Western Africa | 0.0 /100 | #269 | Tragic 5.9% |
| Immigrants | Honduras | 0.0 /100 | #270 | Tragic 5.9% |
| Central Americans | 0.0 /100 | #271 | Tragic 5.9% |
| Lumbee | 0.0 /100 | #272 | Tragic 5.9% |
Demographics Similar to Immigrants from Philippines by Female Unemployment
In terms of female unemployment, the demographic groups most similar to Immigrants from Philippines are Israeli (5.5%, a difference of 0.16%), Immigrants from Peru (5.5%, a difference of 0.17%), Panamanian (5.5%, a difference of 0.17%), Immigrants from Uruguay (5.5%, a difference of 0.18%), and French American Indian (5.5%, a difference of 0.21%).
| Demographics | Rating | Rank | Female Unemployment |
| Immigrants | Africa | 8.5 /100 | #220 | Tragic 5.4% |
| Brazilians | 7.3 /100 | #221 | Tragic 5.5% |
| Nicaraguans | 7.2 /100 | #222 | Tragic 5.5% |
| Delaware | 7.2 /100 | #223 | Tragic 5.5% |
| Iraqis | 7.1 /100 | #224 | Tragic 5.5% |
| French American Indians | 6.1 /100 | #225 | Tragic 5.5% |
| Immigrants | Peru | 5.9 /100 | #226 | Tragic 5.5% |
| Immigrants | Philippines | 5.3 /100 | #227 | Tragic 5.5% |
| Israelis | 4.8 /100 | #228 | Tragic 5.5% |
| Panamanians | 4.7 /100 | #229 | Tragic 5.5% |
| Immigrants | Uruguay | 4.7 /100 | #230 | Tragic 5.5% |
| Immigrants | Iraq | 3.9 /100 | #231 | Tragic 5.5% |
| Liberians | 3.9 /100 | #232 | Tragic 5.5% |
| Moroccans | 3.4 /100 | #233 | Tragic 5.5% |
| Immigrants | Lebanon | 3.3 /100 | #234 | Tragic 5.5% |