Bhutanese vs Immigrants from Romania Ambulatory Disability
COMPARE
Bhutanese
Immigrants from Romania
Ambulatory Disability
Ambulatory Disability Comparison
Bhutanese
Immigrants from Romania
5.8%
AMBULATORY DISABILITY
98.8/ 100
METRIC RATING
89th/ 347
METRIC RANK
5.8%
AMBULATORY DISABILITY
97.7/ 100
METRIC RATING
103rd/ 347
METRIC RANK
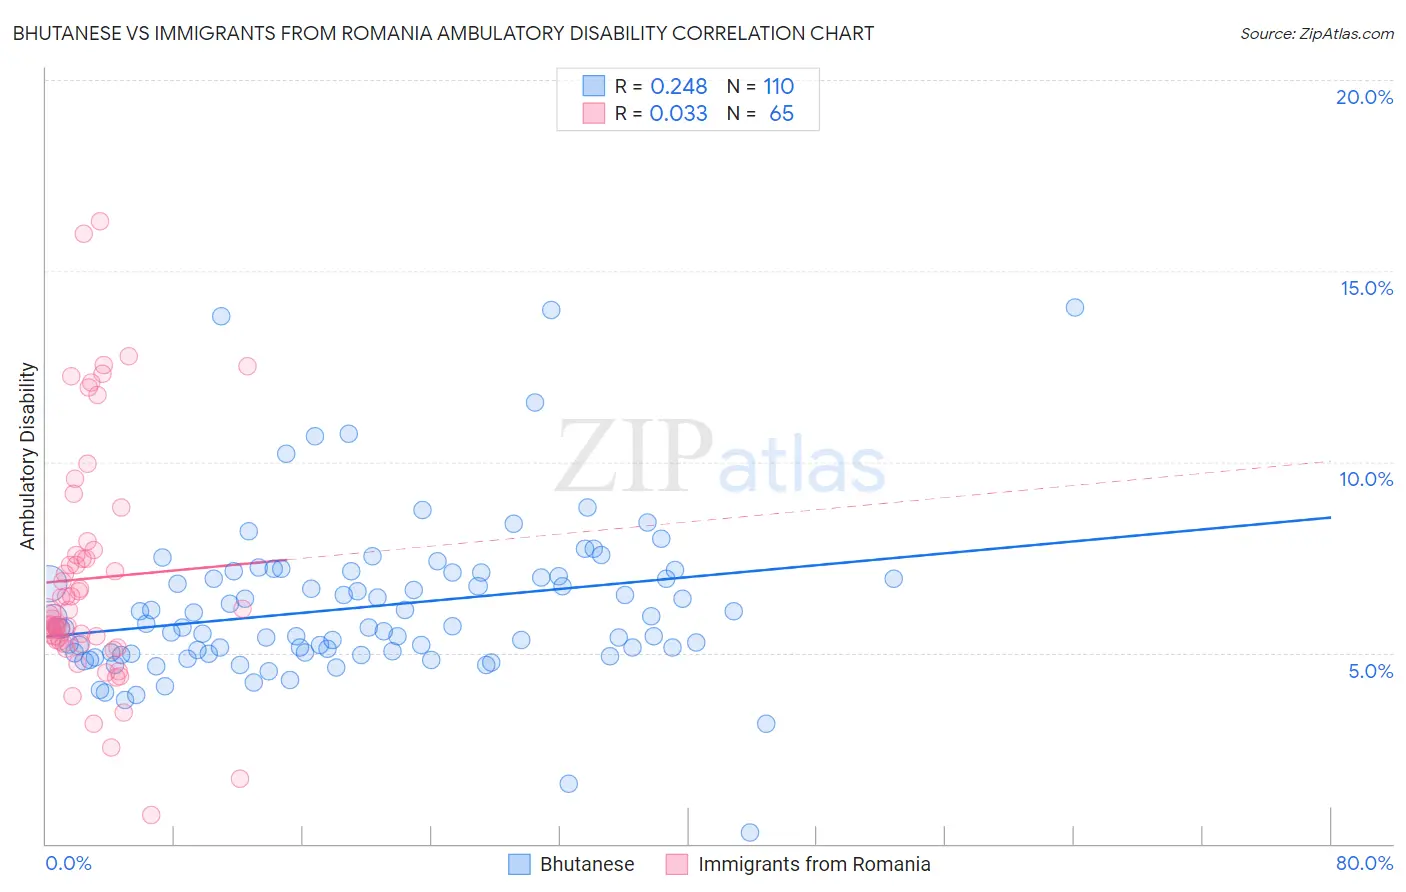
Bhutanese vs Immigrants from Romania Ambulatory Disability Correlation Chart
The statistical analysis conducted on geographies consisting of 455,305,094 people shows a weak positive correlation between the proportion of Bhutanese and percentage of population with ambulatory disability in the United States with a correlation coefficient (R) of 0.248 and weighted average of 5.8%. Similarly, the statistical analysis conducted on geographies consisting of 256,972,629 people shows no correlation between the proportion of Immigrants from Romania and percentage of population with ambulatory disability in the United States with a correlation coefficient (R) of 0.033 and weighted average of 5.8%, a difference of 0.93%.
Ambulatory Disability Correlation Summary
| Measurement | Bhutanese | Immigrants from Romania |
| Minimum | 0.28% | 0.77% |
| Maximum | 14.0% | 16.3% |
| Range | 13.8% | 15.5% |
| Mean | 6.2% | 6.9% |
| Median | 5.7% | 6.0% |
| Interquartile 25% (IQ1) | 5.0% | 5.3% |
| Interquartile 75% (IQ3) | 7.0% | 7.6% |
| Interquartile Range (IQR) | 2.0% | 2.4% |
| Standard Deviation (Sample) | 2.1% | 3.1% |
| Standard Deviation (Population) | 2.1% | 3.1% |
Demographics Similar to Bhutanese and Immigrants from Romania by Ambulatory Disability
In terms of ambulatory disability, the demographic groups most similar to Bhutanese are Australian (5.8%, a difference of 0.0%), Immigrants from Sudan (5.8%, a difference of 0.0%), Soviet Union (5.8%, a difference of 0.12%), Immigrants from Chile (5.8%, a difference of 0.16%), and Immigrants from Sierra Leone (5.8%, a difference of 0.17%). Similarly, the demographic groups most similar to Immigrants from Romania are New Zealander (5.8%, a difference of 0.060%), Immigrants from Kenya (5.8%, a difference of 0.070%), Immigrants from Serbia (5.8%, a difference of 0.15%), Immigrants from South America (5.8%, a difference of 0.15%), and Immigrants from Czechoslovakia (5.8%, a difference of 0.17%).
| Demographics | Rating | Rank | Ambulatory Disability |
| Latvians | 99.0 /100 | #86 | Exceptional 5.7% |
| Immigrants | Chile | 98.9 /100 | #87 | Exceptional 5.8% |
| Soviet Union | 98.9 /100 | #88 | Exceptional 5.8% |
| Bhutanese | 98.8 /100 | #89 | Exceptional 5.8% |
| Australians | 98.8 /100 | #90 | Exceptional 5.8% |
| Immigrants | Sudan | 98.8 /100 | #91 | Exceptional 5.8% |
| Immigrants | Sierra Leone | 98.6 /100 | #92 | Exceptional 5.8% |
| Immigrants | Denmark | 98.6 /100 | #93 | Exceptional 5.8% |
| Kenyans | 98.4 /100 | #94 | Exceptional 5.8% |
| Immigrants | El Salvador | 98.4 /100 | #95 | Exceptional 5.8% |
| Salvadorans | 98.4 /100 | #96 | Exceptional 5.8% |
| Immigrants | Somalia | 98.3 /100 | #97 | Exceptional 5.8% |
| Immigrants | Lebanon | 98.3 /100 | #98 | Exceptional 5.8% |
| Immigrants | Northern Europe | 98.2 /100 | #99 | Exceptional 5.8% |
| Immigrants | Serbia | 97.9 /100 | #100 | Exceptional 5.8% |
| Immigrants | South America | 97.9 /100 | #101 | Exceptional 5.8% |
| Immigrants | Kenya | 97.8 /100 | #102 | Exceptional 5.8% |
| Immigrants | Romania | 97.7 /100 | #103 | Exceptional 5.8% |
| New Zealanders | 97.6 /100 | #104 | Exceptional 5.8% |
| Immigrants | Czechoslovakia | 97.4 /100 | #105 | Exceptional 5.8% |
| Immigrants | Morocco | 97.3 /100 | #106 | Exceptional 5.8% |