Belizean vs Immigrants from China Disability
COMPARE
Belizean
Immigrants from China
Disability
Disability Comparison
Belizeans
Immigrants from China
11.9%
DISABILITY
12.8/ 100
METRIC RATING
200th/ 347
METRIC RANK
10.1%
DISABILITY
100.0/ 100
METRIC RATING
10th/ 347
METRIC RANK
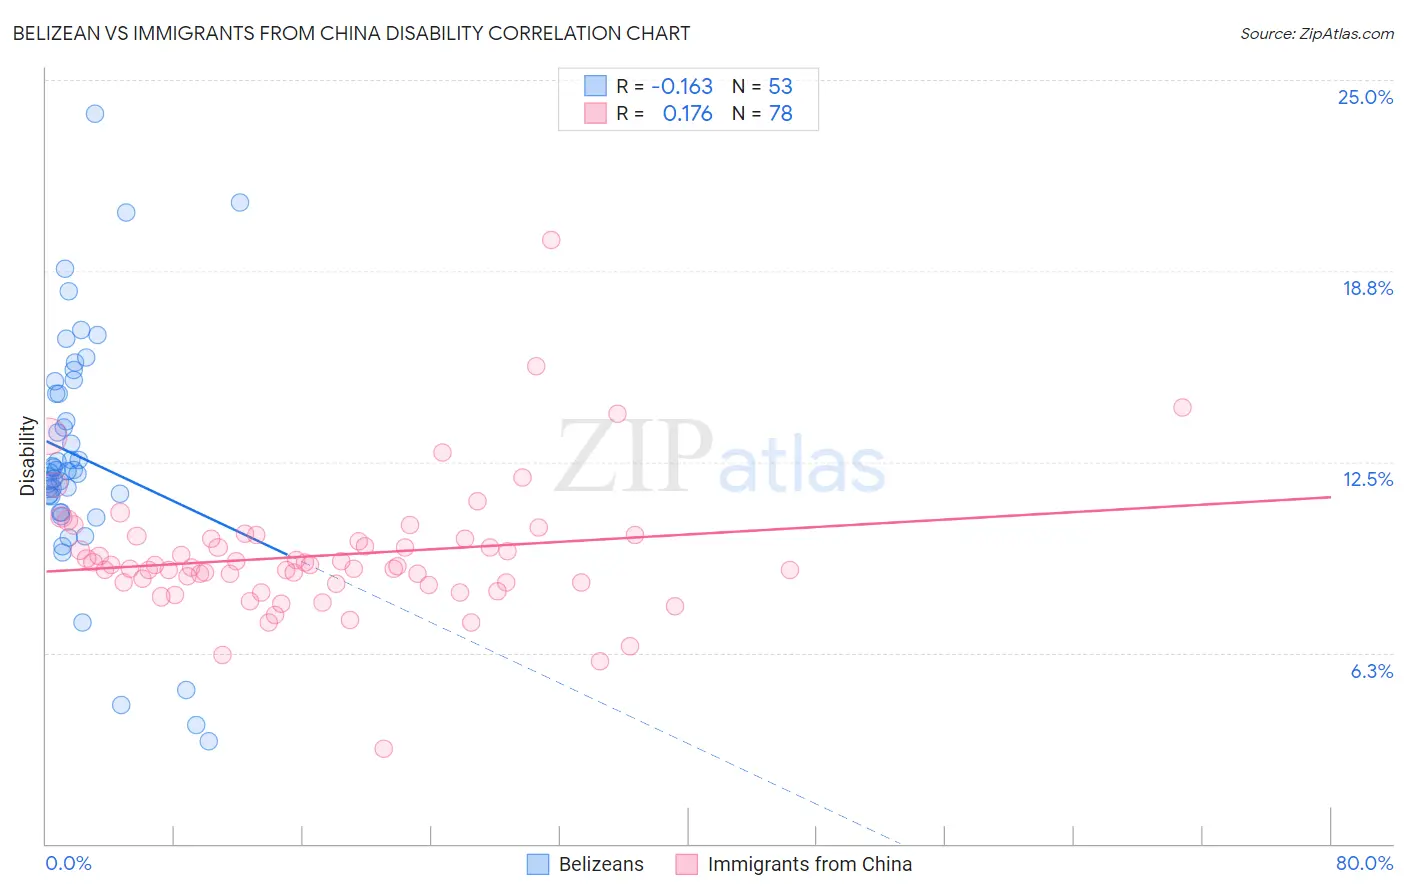
Belizean vs Immigrants from China Disability Correlation Chart
The statistical analysis conducted on geographies consisting of 144,197,719 people shows a poor negative correlation between the proportion of Belizeans and percentage of population with a disability in the United States with a correlation coefficient (R) of -0.163 and weighted average of 11.9%. Similarly, the statistical analysis conducted on geographies consisting of 457,054,974 people shows a poor positive correlation between the proportion of Immigrants from China and percentage of population with a disability in the United States with a correlation coefficient (R) of 0.176 and weighted average of 10.1%, a difference of 18.1%.
Disability Correlation Summary
| Measurement | Belizean | Immigrants from China |
| Minimum | 3.4% | 3.1% |
| Maximum | 23.9% | 19.7% |
| Range | 20.5% | 16.6% |
| Mean | 12.7% | 9.4% |
| Median | 12.2% | 9.1% |
| Interquartile 25% (IQ1) | 11.1% | 8.5% |
| Interquartile 75% (IQ3) | 14.9% | 10.0% |
| Interquartile Range (IQR) | 3.8% | 1.4% |
| Standard Deviation (Sample) | 3.9% | 2.2% |
| Standard Deviation (Population) | 3.9% | 2.1% |
Similar Demographics by Disability
Demographics Similar to Belizeans by Disability
In terms of disability, the demographic groups most similar to Belizeans are Assyrian/Chaldean/Syriac (11.9%, a difference of 0.020%), Immigrants from England (12.0%, a difference of 0.090%), British West Indian (12.0%, a difference of 0.14%), Mexican American Indian (12.0%, a difference of 0.14%), and Immigrants from Panama (11.9%, a difference of 0.16%).
| Demographics | Rating | Rank | Disability |
| Immigrants | Bosnia and Herzegovina | 18.0 /100 | #193 | Poor 11.9% |
| Somalis | 17.3 /100 | #194 | Poor 11.9% |
| Barbadians | 15.8 /100 | #195 | Poor 11.9% |
| Serbians | 15.4 /100 | #196 | Poor 11.9% |
| Immigrants | Belize | 15.2 /100 | #197 | Poor 11.9% |
| Ukrainians | 14.7 /100 | #198 | Poor 11.9% |
| Immigrants | Panama | 14.6 /100 | #199 | Poor 11.9% |
| Belizeans | 12.8 /100 | #200 | Poor 11.9% |
| Assyrians/Chaldeans/Syriacs | 12.6 /100 | #201 | Poor 11.9% |
| Immigrants | England | 12.0 /100 | #202 | Poor 12.0% |
| British West Indians | 11.5 /100 | #203 | Poor 12.0% |
| Mexican American Indians | 11.4 /100 | #204 | Poor 12.0% |
| Immigrants | Western Europe | 10.1 /100 | #205 | Poor 12.0% |
| Immigrants | Senegal | 9.4 /100 | #206 | Tragic 12.0% |
| Immigrants | Thailand | 9.3 /100 | #207 | Tragic 12.0% |
Demographics Similar to Immigrants from China by Disability
In terms of disability, the demographic groups most similar to Immigrants from China are Iranian (10.1%, a difference of 0.010%), Immigrants from Israel (10.1%, a difference of 0.26%), Immigrants from Eastern Asia (10.2%, a difference of 0.47%), Immigrants from Hong Kong (10.0%, a difference of 0.81%), and Immigrants from Korea (10.2%, a difference of 1.1%).
| Demographics | Rating | Rank | Disability |
| Immigrants | Taiwan | 100.0 /100 | #3 | Exceptional 9.6% |
| Thais | 100.0 /100 | #4 | Exceptional 9.7% |
| Immigrants | Bolivia | 100.0 /100 | #5 | Exceptional 9.9% |
| Immigrants | South Central Asia | 100.0 /100 | #6 | Exceptional 9.9% |
| Immigrants | Singapore | 100.0 /100 | #7 | Exceptional 10.0% |
| Bolivians | 100.0 /100 | #8 | Exceptional 10.0% |
| Immigrants | Hong Kong | 100.0 /100 | #9 | Exceptional 10.0% |
| Immigrants | China | 100.0 /100 | #10 | Exceptional 10.1% |
| Iranians | 100.0 /100 | #11 | Exceptional 10.1% |
| Immigrants | Israel | 100.0 /100 | #12 | Exceptional 10.1% |
| Immigrants | Eastern Asia | 100.0 /100 | #13 | Exceptional 10.2% |
| Immigrants | Korea | 100.0 /100 | #14 | Exceptional 10.2% |
| Okinawans | 100.0 /100 | #15 | Exceptional 10.3% |
| Indians (Asian) | 100.0 /100 | #16 | Exceptional 10.3% |
| Immigrants | Iran | 100.0 /100 | #17 | Exceptional 10.3% |