Belizean vs Immigrants from Latvia Disability
COMPARE
Belizean
Immigrants from Latvia
Disability
Disability Comparison
Belizeans
Immigrants from Latvia
11.9%
DISABILITY
12.8/ 100
METRIC RATING
200th/ 347
METRIC RANK
11.4%
DISABILITY
90.9/ 100
METRIC RATING
126th/ 347
METRIC RANK
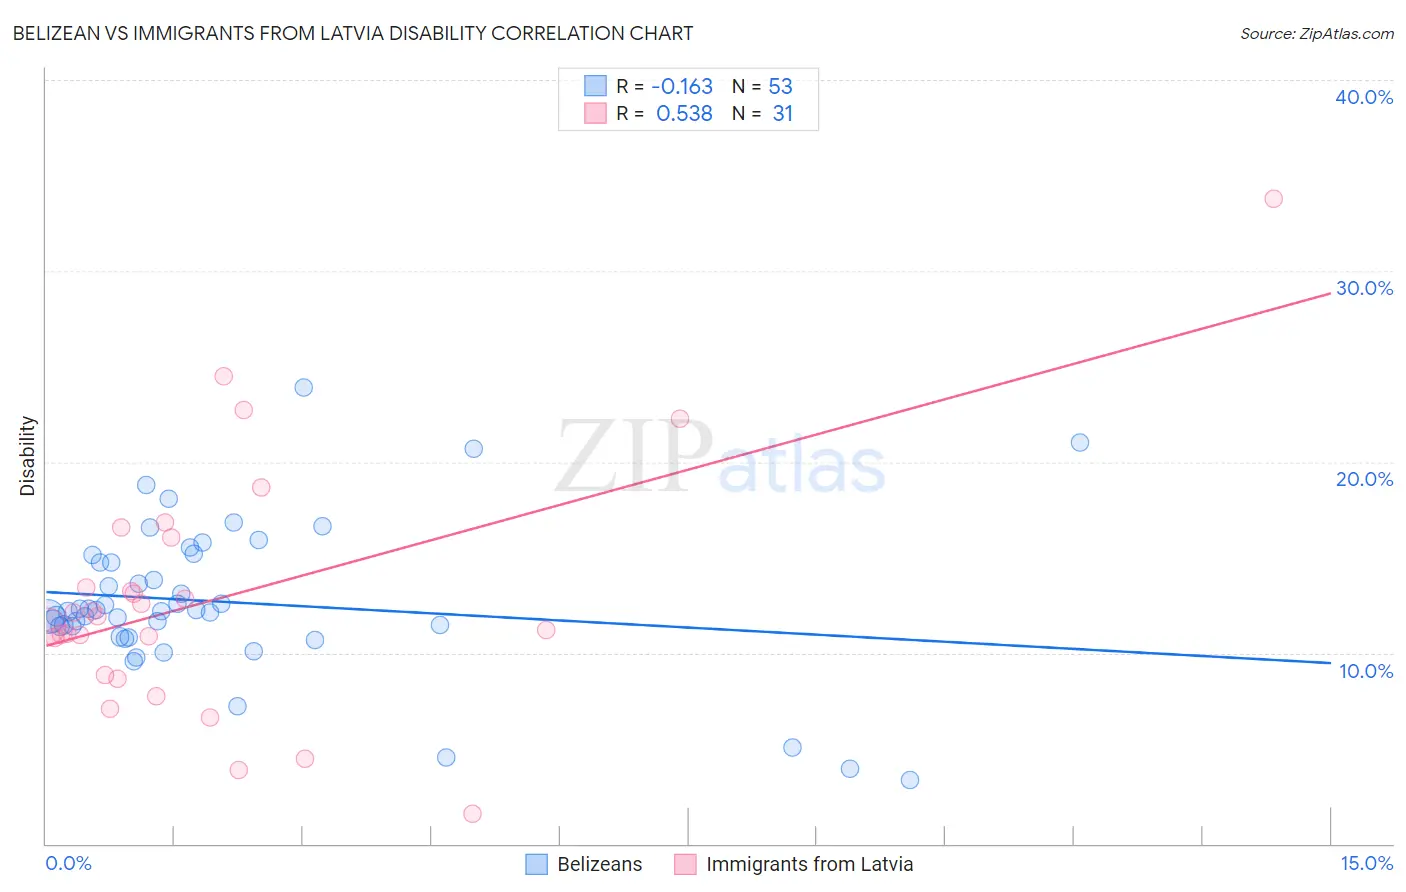
Belizean vs Immigrants from Latvia Disability Correlation Chart
The statistical analysis conducted on geographies consisting of 144,197,719 people shows a poor negative correlation between the proportion of Belizeans and percentage of population with a disability in the United States with a correlation coefficient (R) of -0.163 and weighted average of 11.9%. Similarly, the statistical analysis conducted on geographies consisting of 113,739,259 people shows a substantial positive correlation between the proportion of Immigrants from Latvia and percentage of population with a disability in the United States with a correlation coefficient (R) of 0.538 and weighted average of 11.4%, a difference of 4.8%.
Disability Correlation Summary
| Measurement | Belizean | Immigrants from Latvia |
| Minimum | 3.4% | 1.5% |
| Maximum | 23.9% | 33.8% |
| Range | 20.5% | 32.2% |
| Mean | 12.7% | 12.9% |
| Median | 12.2% | 11.9% |
| Interquartile 25% (IQ1) | 11.1% | 8.8% |
| Interquartile 75% (IQ3) | 14.9% | 16.0% |
| Interquartile Range (IQR) | 3.8% | 7.2% |
| Standard Deviation (Sample) | 3.9% | 6.5% |
| Standard Deviation (Population) | 3.9% | 6.4% |
Similar Demographics by Disability
Demographics Similar to Belizeans by Disability
In terms of disability, the demographic groups most similar to Belizeans are Assyrian/Chaldean/Syriac (11.9%, a difference of 0.020%), Immigrants from England (12.0%, a difference of 0.090%), British West Indian (12.0%, a difference of 0.14%), Mexican American Indian (12.0%, a difference of 0.14%), and Immigrants from Panama (11.9%, a difference of 0.16%).
| Demographics | Rating | Rank | Disability |
| Immigrants | Bosnia and Herzegovina | 18.0 /100 | #193 | Poor 11.9% |
| Somalis | 17.3 /100 | #194 | Poor 11.9% |
| Barbadians | 15.8 /100 | #195 | Poor 11.9% |
| Serbians | 15.4 /100 | #196 | Poor 11.9% |
| Immigrants | Belize | 15.2 /100 | #197 | Poor 11.9% |
| Ukrainians | 14.7 /100 | #198 | Poor 11.9% |
| Immigrants | Panama | 14.6 /100 | #199 | Poor 11.9% |
| Belizeans | 12.8 /100 | #200 | Poor 11.9% |
| Assyrians/Chaldeans/Syriacs | 12.6 /100 | #201 | Poor 11.9% |
| Immigrants | England | 12.0 /100 | #202 | Poor 12.0% |
| British West Indians | 11.5 /100 | #203 | Poor 12.0% |
| Mexican American Indians | 11.4 /100 | #204 | Poor 12.0% |
| Immigrants | Western Europe | 10.1 /100 | #205 | Poor 12.0% |
| Immigrants | Senegal | 9.4 /100 | #206 | Tragic 12.0% |
| Immigrants | Thailand | 9.3 /100 | #207 | Tragic 12.0% |
Demographics Similar to Immigrants from Latvia by Disability
In terms of disability, the demographic groups most similar to Immigrants from Latvia are Immigrants from Italy (11.4%, a difference of 0.070%), Immigrants from Europe (11.4%, a difference of 0.070%), Macedonian (11.4%, a difference of 0.080%), Latvian (11.4%, a difference of 0.14%), and Costa Rican (11.4%, a difference of 0.15%).
| Demographics | Rating | Rank | Disability |
| Central Americans | 93.5 /100 | #119 | Exceptional 11.4% |
| Immigrants | North Macedonia | 93.5 /100 | #120 | Exceptional 11.4% |
| Immigrants | Costa Rica | 93.4 /100 | #121 | Exceptional 11.4% |
| Brazilians | 93.3 /100 | #122 | Exceptional 11.4% |
| South Africans | 92.3 /100 | #123 | Exceptional 11.4% |
| South American Indians | 92.2 /100 | #124 | Exceptional 11.4% |
| Costa Ricans | 91.9 /100 | #125 | Exceptional 11.4% |
| Immigrants | Latvia | 90.9 /100 | #126 | Exceptional 11.4% |
| Immigrants | Italy | 90.4 /100 | #127 | Exceptional 11.4% |
| Immigrants | Europe | 90.4 /100 | #128 | Exceptional 11.4% |
| Macedonians | 90.3 /100 | #129 | Exceptional 11.4% |
| Latvians | 89.8 /100 | #130 | Excellent 11.4% |
| Immigrants | Croatia | 89.8 /100 | #131 | Excellent 11.4% |
| Immigrants | Africa | 89.3 /100 | #132 | Excellent 11.4% |
| Arabs | 89.1 /100 | #133 | Excellent 11.4% |