Belizean vs Hispanic or Latino Ambulatory Disability
COMPARE
Belizean
Hispanic or Latino
Ambulatory Disability
Ambulatory Disability Comparison
Belizeans
Hispanics or Latinos
6.5%
AMBULATORY DISABILITY
0.7/ 100
METRIC RATING
254th/ 347
METRIC RANK
6.4%
AMBULATORY DISABILITY
2.2/ 100
METRIC RATING
235th/ 347
METRIC RANK
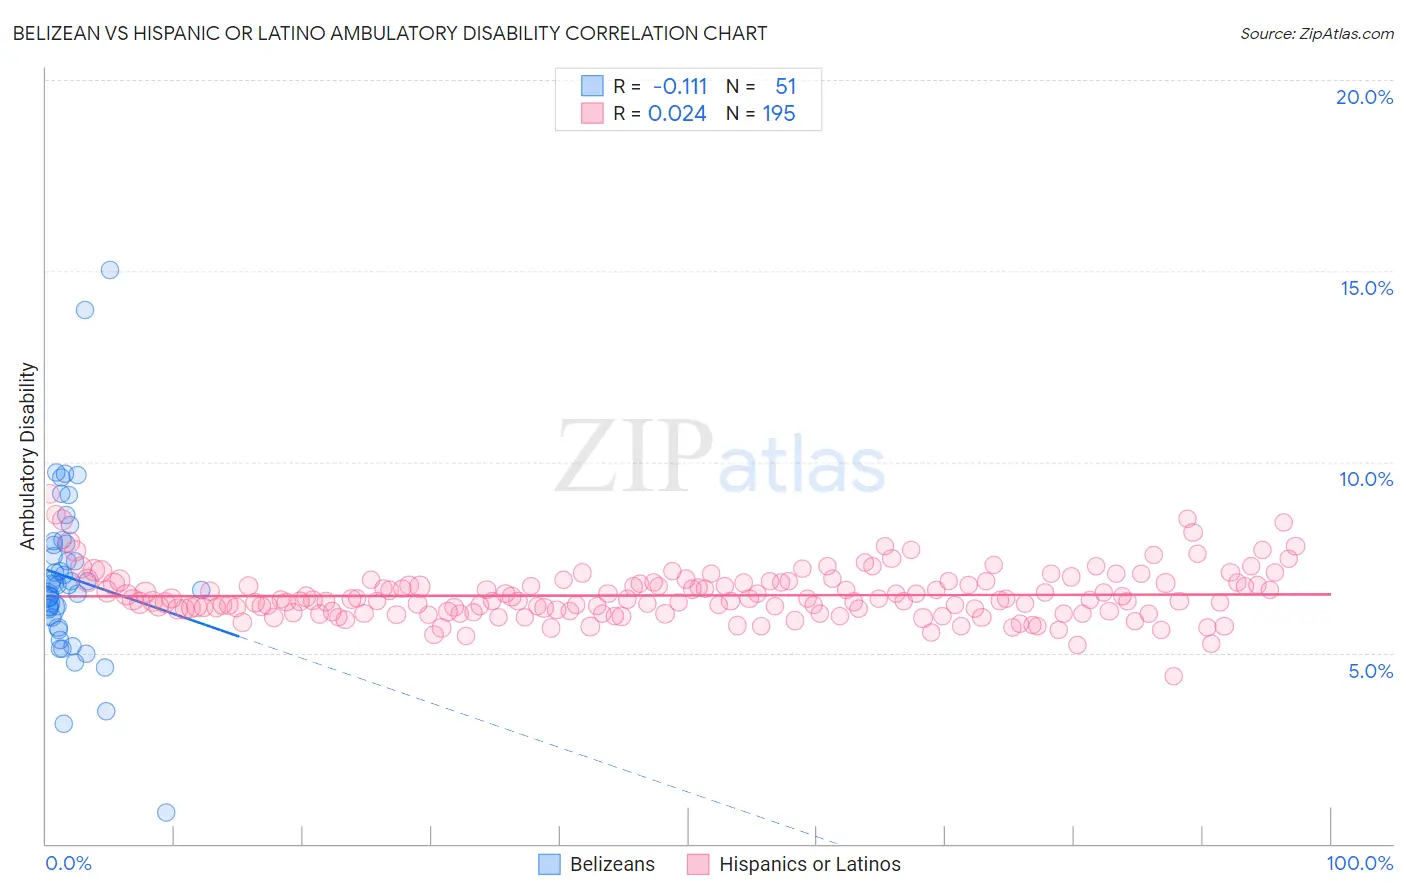
Belizean vs Hispanic or Latino Ambulatory Disability Correlation Chart
The statistical analysis conducted on geographies consisting of 144,187,232 people shows a poor negative correlation between the proportion of Belizeans and percentage of population with ambulatory disability in the United States with a correlation coefficient (R) of -0.111 and weighted average of 6.5%. Similarly, the statistical analysis conducted on geographies consisting of 572,469,194 people shows no correlation between the proportion of Hispanics or Latinos and percentage of population with ambulatory disability in the United States with a correlation coefficient (R) of 0.024 and weighted average of 6.4%, a difference of 1.6%.
Ambulatory Disability Correlation Summary
| Measurement | Belizean | Hispanic or Latino |
| Minimum | 0.81% | 4.4% |
| Maximum | 15.0% | 9.2% |
| Range | 14.2% | 4.8% |
| Mean | 7.0% | 6.5% |
| Median | 6.8% | 6.4% |
| Interquartile 25% (IQ1) | 5.9% | 6.1% |
| Interquartile 75% (IQ3) | 7.9% | 6.8% |
| Interquartile Range (IQR) | 1.9% | 0.75% |
| Standard Deviation (Sample) | 2.3% | 0.65% |
| Standard Deviation (Population) | 2.3% | 0.65% |
Demographics Similar to Belizeans and Hispanics or Latinos by Ambulatory Disability
In terms of ambulatory disability, the demographic groups most similar to Belizeans are Scottish (6.5%, a difference of 0.16%), Immigrants from Bahamas (6.5%, a difference of 0.21%), Hawaiian (6.5%, a difference of 0.41%), Chinese (6.5%, a difference of 0.59%), and Native Hawaiian (6.5%, a difference of 0.67%). Similarly, the demographic groups most similar to Hispanics or Latinos are Immigrants from Liberia (6.4%, a difference of 0.030%), Dutch (6.4%, a difference of 0.15%), Immigrants from Germany (6.4%, a difference of 0.24%), Haitian (6.4%, a difference of 0.25%), and Senegalese (6.4%, a difference of 0.32%).
| Demographics | Rating | Rank | Ambulatory Disability |
| Immigrants | Liberia | 2.3 /100 | #234 | Tragic 6.4% |
| Hispanics or Latinos | 2.2 /100 | #235 | Tragic 6.4% |
| Dutch | 2.0 /100 | #236 | Tragic 6.4% |
| Immigrants | Germany | 1.8 /100 | #237 | Tragic 6.4% |
| Haitians | 1.8 /100 | #238 | Tragic 6.4% |
| Senegalese | 1.7 /100 | #239 | Tragic 6.4% |
| Immigrants | Senegal | 1.7 /100 | #240 | Tragic 6.4% |
| Immigrants | Haiti | 1.6 /100 | #241 | Tragic 6.5% |
| Spaniards | 1.6 /100 | #242 | Tragic 6.5% |
| Germans | 1.5 /100 | #243 | Tragic 6.5% |
| Immigrants | Panama | 1.5 /100 | #244 | Tragic 6.5% |
| Tlingit-Haida | 1.5 /100 | #245 | Tragic 6.5% |
| Armenians | 1.5 /100 | #246 | Tragic 6.5% |
| Immigrants | Cuba | 1.4 /100 | #247 | Tragic 6.5% |
| Immigrants | Portugal | 1.4 /100 | #248 | Tragic 6.5% |
| Native Hawaiians | 1.1 /100 | #249 | Tragic 6.5% |
| Chinese | 1.0 /100 | #250 | Tragic 6.5% |
| Hawaiians | 0.9 /100 | #251 | Tragic 6.5% |
| Immigrants | Bahamas | 0.8 /100 | #252 | Tragic 6.5% |
| Scottish | 0.7 /100 | #253 | Tragic 6.5% |
| Belizeans | 0.7 /100 | #254 | Tragic 6.5% |