Belgian vs Immigrants from Chile Female Disability
COMPARE
Belgian
Immigrants from Chile
Female Disability
Female Disability Comparison
Belgians
Immigrants from Chile
12.5%
FEMALE DISABILITY
6.5/ 100
METRIC RATING
231st/ 347
METRIC RANK
11.5%
FEMALE DISABILITY
99.8/ 100
METRIC RATING
70th/ 347
METRIC RANK
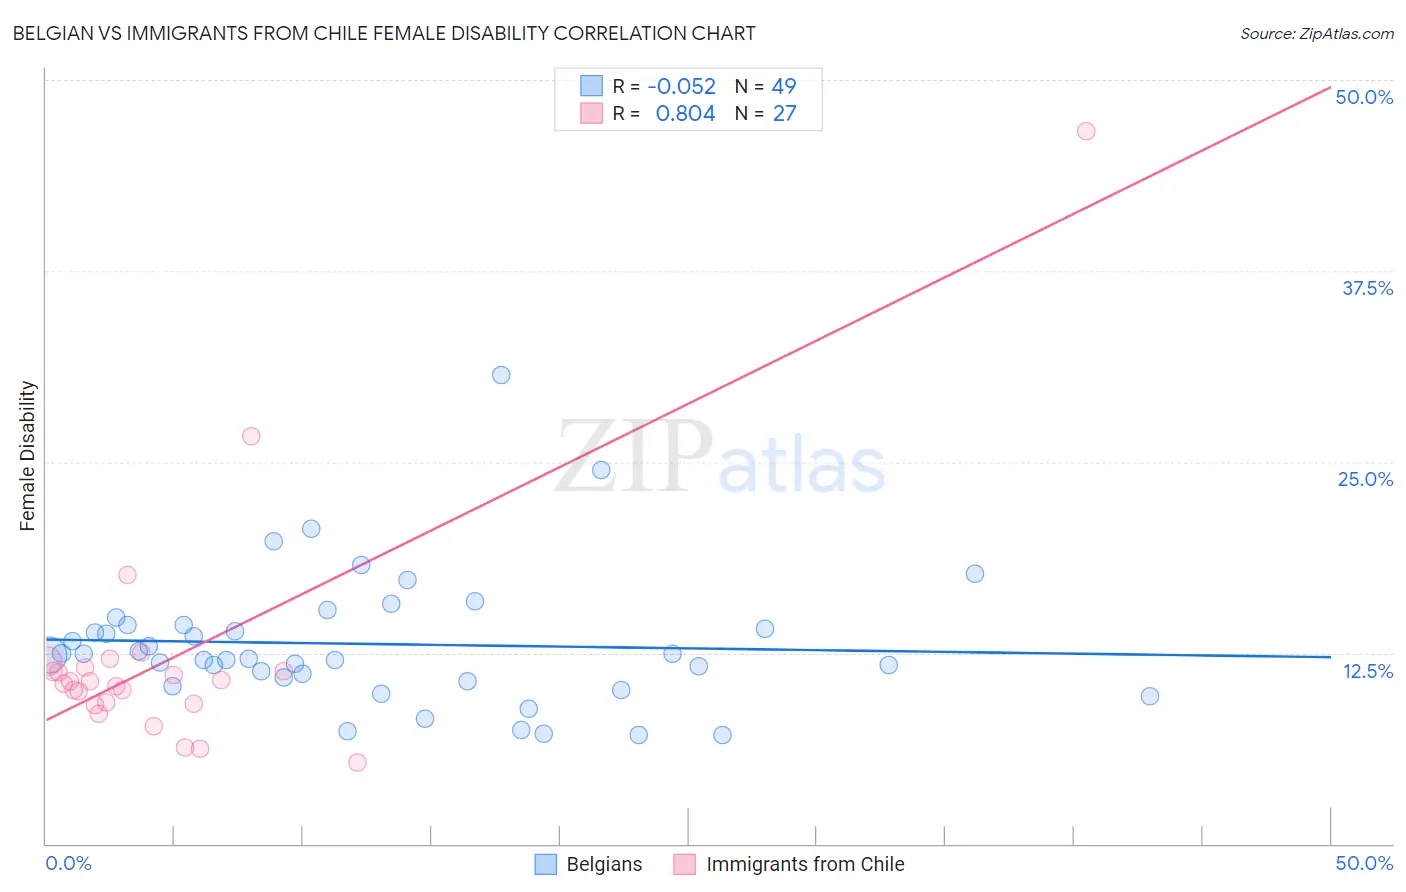
Belgian vs Immigrants from Chile Female Disability Correlation Chart
The statistical analysis conducted on geographies consisting of 355,987,027 people shows a slight negative correlation between the proportion of Belgians and percentage of females with a disability in the United States with a correlation coefficient (R) of -0.052 and weighted average of 12.5%. Similarly, the statistical analysis conducted on geographies consisting of 218,627,850 people shows a very strong positive correlation between the proportion of Immigrants from Chile and percentage of females with a disability in the United States with a correlation coefficient (R) of 0.804 and weighted average of 11.5%, a difference of 8.9%.
Female Disability Correlation Summary
| Measurement | Belgian | Immigrants from Chile |
| Minimum | 7.1% | 5.3% |
| Maximum | 30.7% | 46.7% |
| Range | 23.6% | 41.4% |
| Mean | 13.1% | 12.2% |
| Median | 12.3% | 10.6% |
| Interquartile 25% (IQ1) | 10.8% | 9.2% |
| Interquartile 75% (IQ3) | 14.3% | 11.5% |
| Interquartile Range (IQR) | 3.5% | 2.3% |
| Standard Deviation (Sample) | 4.4% | 7.9% |
| Standard Deviation (Population) | 4.3% | 7.8% |
Similar Demographics by Female Disability
Demographics Similar to Belgians by Female Disability
In terms of female disability, the demographic groups most similar to Belgians are Immigrants from Belize (12.5%, a difference of 0.070%), Immigrants from Somalia (12.5%, a difference of 0.090%), Hungarian (12.5%, a difference of 0.11%), Immigrants from Cambodia (12.5%, a difference of 0.18%), and Immigrants from Iraq (12.5%, a difference of 0.19%).
| Demographics | Rating | Rank | Female Disability |
| Belizeans | 9.3 /100 | #224 | Tragic 12.5% |
| Poles | 8.4 /100 | #225 | Tragic 12.5% |
| Hispanics or Latinos | 8.0 /100 | #226 | Tragic 12.5% |
| Assyrians/Chaldeans/Syriacs | 8.0 /100 | #227 | Tragic 12.5% |
| Immigrants | Cambodia | 7.8 /100 | #228 | Tragic 12.5% |
| Hungarians | 7.2 /100 | #229 | Tragic 12.5% |
| Immigrants | Belize | 7.0 /100 | #230 | Tragic 12.5% |
| Belgians | 6.5 /100 | #231 | Tragic 12.5% |
| Immigrants | Somalia | 5.9 /100 | #232 | Tragic 12.5% |
| Immigrants | Iraq | 5.3 /100 | #233 | Tragic 12.5% |
| Scandinavians | 5.3 /100 | #234 | Tragic 12.5% |
| Malaysians | 5.0 /100 | #235 | Tragic 12.5% |
| Immigrants | West Indies | 4.4 /100 | #236 | Tragic 12.6% |
| Slavs | 3.8 /100 | #237 | Tragic 12.6% |
| Yugoslavians | 3.7 /100 | #238 | Tragic 12.6% |
Demographics Similar to Immigrants from Chile by Female Disability
In terms of female disability, the demographic groups most similar to Immigrants from Chile are Colombian (11.5%, a difference of 0.010%), Immigrants from Ireland (11.5%, a difference of 0.040%), Immigrants from Northern Africa (11.5%, a difference of 0.080%), Immigrants from Vietnam (11.5%, a difference of 0.10%), and Chilean (11.5%, a difference of 0.11%).
| Demographics | Rating | Rank | Female Disability |
| Immigrants | Colombia | 99.9 /100 | #63 | Exceptional 11.4% |
| Immigrants | El Salvador | 99.9 /100 | #64 | Exceptional 11.4% |
| Immigrants | South America | 99.9 /100 | #65 | Exceptional 11.4% |
| Salvadorans | 99.8 /100 | #66 | Exceptional 11.5% |
| Immigrants | Vietnam | 99.8 /100 | #67 | Exceptional 11.5% |
| Immigrants | Northern Africa | 99.8 /100 | #68 | Exceptional 11.5% |
| Colombians | 99.8 /100 | #69 | Exceptional 11.5% |
| Immigrants | Chile | 99.8 /100 | #70 | Exceptional 11.5% |
| Immigrants | Ireland | 99.8 /100 | #71 | Exceptional 11.5% |
| Chileans | 99.8 /100 | #72 | Exceptional 11.5% |
| Immigrants | Switzerland | 99.8 /100 | #73 | Exceptional 11.5% |
| Bhutanese | 99.8 /100 | #74 | Exceptional 11.5% |
| Immigrants | Lebanon | 99.7 /100 | #75 | Exceptional 11.5% |
| Immigrants | Eritrea | 99.7 /100 | #76 | Exceptional 11.5% |
| Immigrants | Afghanistan | 99.7 /100 | #77 | Exceptional 11.5% |