Maltese vs Immigrants from Chile Female Disability
COMPARE
Maltese
Immigrants from Chile
Female Disability
Female Disability Comparison
Maltese
Immigrants from Chile
12.2%
FEMALE DISABILITY
57.0/ 100
METRIC RATING
170th/ 347
METRIC RANK
11.5%
FEMALE DISABILITY
99.8/ 100
METRIC RATING
70th/ 347
METRIC RANK
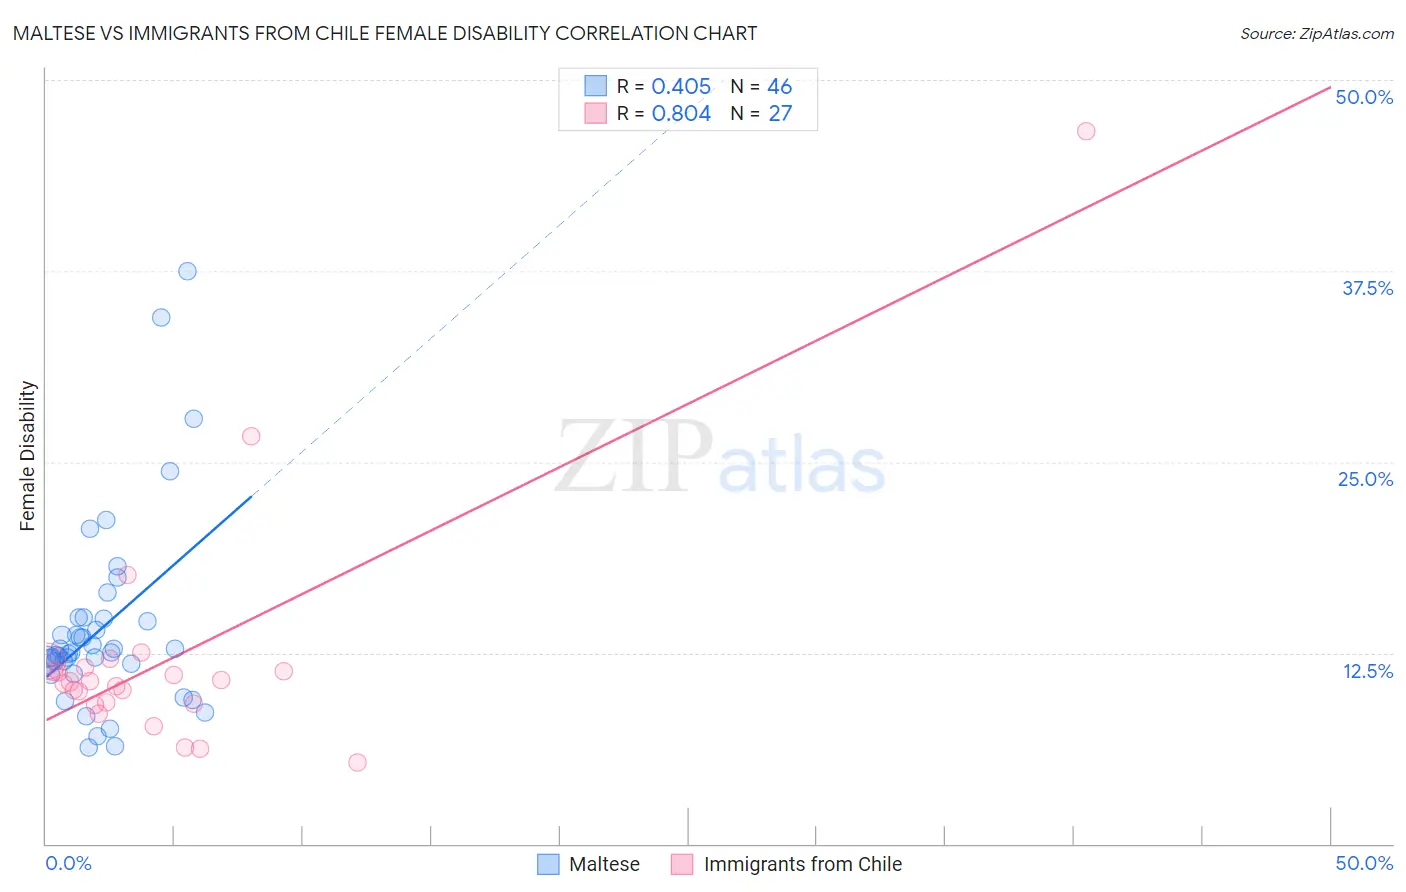
Maltese vs Immigrants from Chile Female Disability Correlation Chart
The statistical analysis conducted on geographies consisting of 126,465,818 people shows a moderate positive correlation between the proportion of Maltese and percentage of females with a disability in the United States with a correlation coefficient (R) of 0.405 and weighted average of 12.2%. Similarly, the statistical analysis conducted on geographies consisting of 218,627,850 people shows a very strong positive correlation between the proportion of Immigrants from Chile and percentage of females with a disability in the United States with a correlation coefficient (R) of 0.804 and weighted average of 11.5%, a difference of 6.0%.
Female Disability Correlation Summary
| Measurement | Maltese | Immigrants from Chile |
| Minimum | 6.3% | 5.3% |
| Maximum | 37.5% | 46.7% |
| Range | 31.2% | 41.4% |
| Mean | 14.1% | 12.2% |
| Median | 12.5% | 10.6% |
| Interquartile 25% (IQ1) | 11.7% | 9.2% |
| Interquartile 75% (IQ3) | 14.7% | 11.5% |
| Interquartile Range (IQR) | 3.0% | 2.3% |
| Standard Deviation (Sample) | 6.3% | 7.9% |
| Standard Deviation (Population) | 6.3% | 7.8% |
Similar Demographics by Female Disability
Demographics Similar to Maltese by Female Disability
In terms of female disability, the demographic groups most similar to Maltese are Immigrants from Southern Europe (12.2%, a difference of 0.030%), Lebanese (12.2%, a difference of 0.040%), Immigrants from Haiti (12.2%, a difference of 0.070%), Immigrants from Latin America (12.2%, a difference of 0.080%), and Lithuanian (12.2%, a difference of 0.10%).
| Demographics | Rating | Rank | Female Disability |
| Guatemalans | 63.8 /100 | #163 | Good 12.1% |
| Czechs | 63.6 /100 | #164 | Good 12.1% |
| Immigrants | Oceania | 61.8 /100 | #165 | Good 12.1% |
| Lithuanians | 59.5 /100 | #166 | Average 12.2% |
| Immigrants | Latin America | 59.0 /100 | #167 | Average 12.2% |
| Immigrants | Haiti | 58.8 /100 | #168 | Average 12.2% |
| Lebanese | 58.1 /100 | #169 | Average 12.2% |
| Maltese | 57.0 /100 | #170 | Average 12.2% |
| Immigrants | Southern Europe | 56.3 /100 | #171 | Average 12.2% |
| Haitians | 51.9 /100 | #172 | Average 12.2% |
| Immigrants | Mexico | 50.8 /100 | #173 | Average 12.2% |
| Immigrants | England | 50.0 /100 | #174 | Average 12.2% |
| Immigrants | St. Vincent and the Grenadines | 49.7 /100 | #175 | Average 12.2% |
| Immigrants | Guyana | 43.1 /100 | #176 | Average 12.2% |
| Immigrants | Ghana | 42.5 /100 | #177 | Average 12.2% |
Demographics Similar to Immigrants from Chile by Female Disability
In terms of female disability, the demographic groups most similar to Immigrants from Chile are Colombian (11.5%, a difference of 0.010%), Immigrants from Ireland (11.5%, a difference of 0.040%), Immigrants from Northern Africa (11.5%, a difference of 0.080%), Immigrants from Vietnam (11.5%, a difference of 0.10%), and Chilean (11.5%, a difference of 0.11%).
| Demographics | Rating | Rank | Female Disability |
| Immigrants | Colombia | 99.9 /100 | #63 | Exceptional 11.4% |
| Immigrants | El Salvador | 99.9 /100 | #64 | Exceptional 11.4% |
| Immigrants | South America | 99.9 /100 | #65 | Exceptional 11.4% |
| Salvadorans | 99.8 /100 | #66 | Exceptional 11.5% |
| Immigrants | Vietnam | 99.8 /100 | #67 | Exceptional 11.5% |
| Immigrants | Northern Africa | 99.8 /100 | #68 | Exceptional 11.5% |
| Colombians | 99.8 /100 | #69 | Exceptional 11.5% |
| Immigrants | Chile | 99.8 /100 | #70 | Exceptional 11.5% |
| Immigrants | Ireland | 99.8 /100 | #71 | Exceptional 11.5% |
| Chileans | 99.8 /100 | #72 | Exceptional 11.5% |
| Immigrants | Switzerland | 99.8 /100 | #73 | Exceptional 11.5% |
| Bhutanese | 99.8 /100 | #74 | Exceptional 11.5% |
| Immigrants | Lebanon | 99.7 /100 | #75 | Exceptional 11.5% |
| Immigrants | Eritrea | 99.7 /100 | #76 | Exceptional 11.5% |
| Immigrants | Afghanistan | 99.7 /100 | #77 | Exceptional 11.5% |