Turkish vs Immigrants from Chile Female Disability
COMPARE
Turkish
Immigrants from Chile
Female Disability
Female Disability Comparison
Turks
Immigrants from Chile
11.1%
FEMALE DISABILITY
100.0/ 100
METRIC RATING
30th/ 347
METRIC RANK
11.5%
FEMALE DISABILITY
99.8/ 100
METRIC RATING
70th/ 347
METRIC RANK
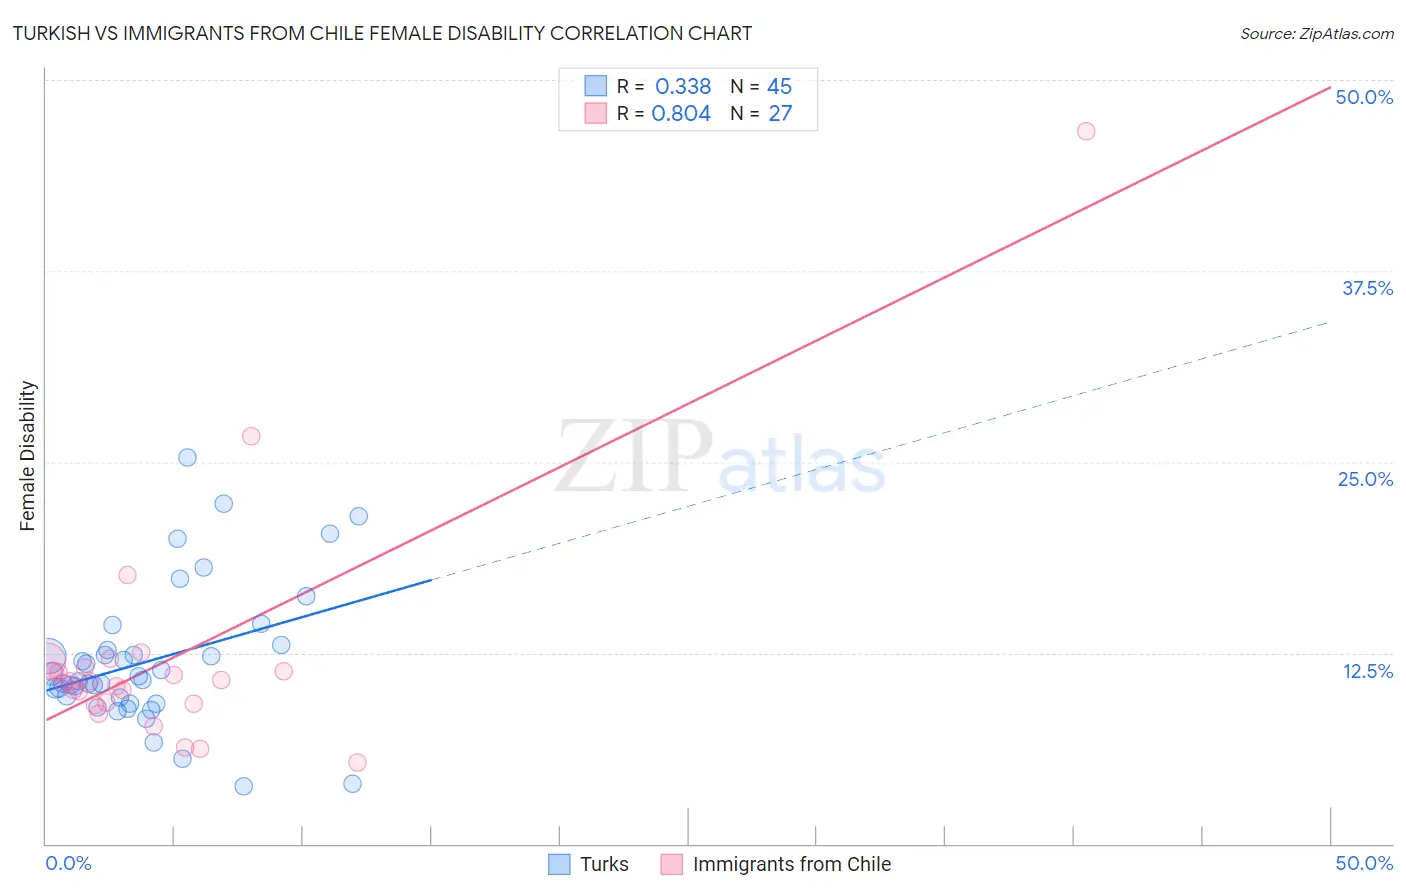
Turkish vs Immigrants from Chile Female Disability Correlation Chart
The statistical analysis conducted on geographies consisting of 271,848,470 people shows a mild positive correlation between the proportion of Turks and percentage of females with a disability in the United States with a correlation coefficient (R) of 0.338 and weighted average of 11.1%. Similarly, the statistical analysis conducted on geographies consisting of 218,627,850 people shows a very strong positive correlation between the proportion of Immigrants from Chile and percentage of females with a disability in the United States with a correlation coefficient (R) of 0.804 and weighted average of 11.5%, a difference of 3.4%.
Female Disability Correlation Summary
| Measurement | Turkish | Immigrants from Chile |
| Minimum | 3.8% | 5.3% |
| Maximum | 25.3% | 46.7% |
| Range | 21.5% | 41.4% |
| Mean | 12.0% | 12.2% |
| Median | 10.7% | 10.6% |
| Interquartile 25% (IQ1) | 9.4% | 9.2% |
| Interquartile 75% (IQ3) | 12.8% | 11.5% |
| Interquartile Range (IQR) | 3.5% | 2.3% |
| Standard Deviation (Sample) | 4.5% | 7.9% |
| Standard Deviation (Population) | 4.5% | 7.8% |
Similar Demographics by Female Disability
Demographics Similar to Turks by Female Disability
In terms of female disability, the demographic groups most similar to Turks are Immigrants from Malaysia (11.1%, a difference of 0.0%), Egyptian (11.1%, a difference of 0.070%), Immigrants from Kuwait (11.1%, a difference of 0.10%), Immigrants from Australia (11.1%, a difference of 0.27%), and Immigrants from Turkey (11.1%, a difference of 0.34%).
| Demographics | Rating | Rank | Female Disability |
| Venezuelans | 100.0 /100 | #23 | Exceptional 11.0% |
| Immigrants | Argentina | 100.0 /100 | #24 | Exceptional 11.0% |
| Immigrants | Asia | 100.0 /100 | #25 | Exceptional 11.0% |
| Argentineans | 100.0 /100 | #26 | Exceptional 11.0% |
| Immigrants | Turkey | 100.0 /100 | #27 | Exceptional 11.1% |
| Egyptians | 100.0 /100 | #28 | Exceptional 11.1% |
| Immigrants | Malaysia | 100.0 /100 | #29 | Exceptional 11.1% |
| Turks | 100.0 /100 | #30 | Exceptional 11.1% |
| Immigrants | Kuwait | 100.0 /100 | #31 | Exceptional 11.1% |
| Immigrants | Australia | 100.0 /100 | #32 | Exceptional 11.1% |
| Immigrants | Egypt | 100.0 /100 | #33 | Exceptional 11.1% |
| Immigrants | Indonesia | 100.0 /100 | #34 | Exceptional 11.2% |
| Immigrants | Japan | 100.0 /100 | #35 | Exceptional 11.2% |
| Cypriots | 100.0 /100 | #36 | Exceptional 11.2% |
| Ethiopians | 100.0 /100 | #37 | Exceptional 11.2% |
Demographics Similar to Immigrants from Chile by Female Disability
In terms of female disability, the demographic groups most similar to Immigrants from Chile are Colombian (11.5%, a difference of 0.010%), Immigrants from Ireland (11.5%, a difference of 0.040%), Immigrants from Northern Africa (11.5%, a difference of 0.080%), Immigrants from Vietnam (11.5%, a difference of 0.10%), and Chilean (11.5%, a difference of 0.11%).
| Demographics | Rating | Rank | Female Disability |
| Immigrants | Colombia | 99.9 /100 | #63 | Exceptional 11.4% |
| Immigrants | El Salvador | 99.9 /100 | #64 | Exceptional 11.4% |
| Immigrants | South America | 99.9 /100 | #65 | Exceptional 11.4% |
| Salvadorans | 99.8 /100 | #66 | Exceptional 11.5% |
| Immigrants | Vietnam | 99.8 /100 | #67 | Exceptional 11.5% |
| Immigrants | Northern Africa | 99.8 /100 | #68 | Exceptional 11.5% |
| Colombians | 99.8 /100 | #69 | Exceptional 11.5% |
| Immigrants | Chile | 99.8 /100 | #70 | Exceptional 11.5% |
| Immigrants | Ireland | 99.8 /100 | #71 | Exceptional 11.5% |
| Chileans | 99.8 /100 | #72 | Exceptional 11.5% |
| Immigrants | Switzerland | 99.8 /100 | #73 | Exceptional 11.5% |
| Bhutanese | 99.8 /100 | #74 | Exceptional 11.5% |
| Immigrants | Lebanon | 99.7 /100 | #75 | Exceptional 11.5% |
| Immigrants | Eritrea | 99.7 /100 | #76 | Exceptional 11.5% |
| Immigrants | Afghanistan | 99.7 /100 | #77 | Exceptional 11.5% |