Alaskan Athabascan vs Immigrants from Chile Female Disability
COMPARE
Alaskan Athabascan
Immigrants from Chile
Female Disability
Female Disability Comparison
Alaskan Athabascans
Immigrants from Chile
13.9%
FEMALE DISABILITY
0.0/ 100
METRIC RATING
315th/ 347
METRIC RANK
11.5%
FEMALE DISABILITY
99.8/ 100
METRIC RATING
70th/ 347
METRIC RANK
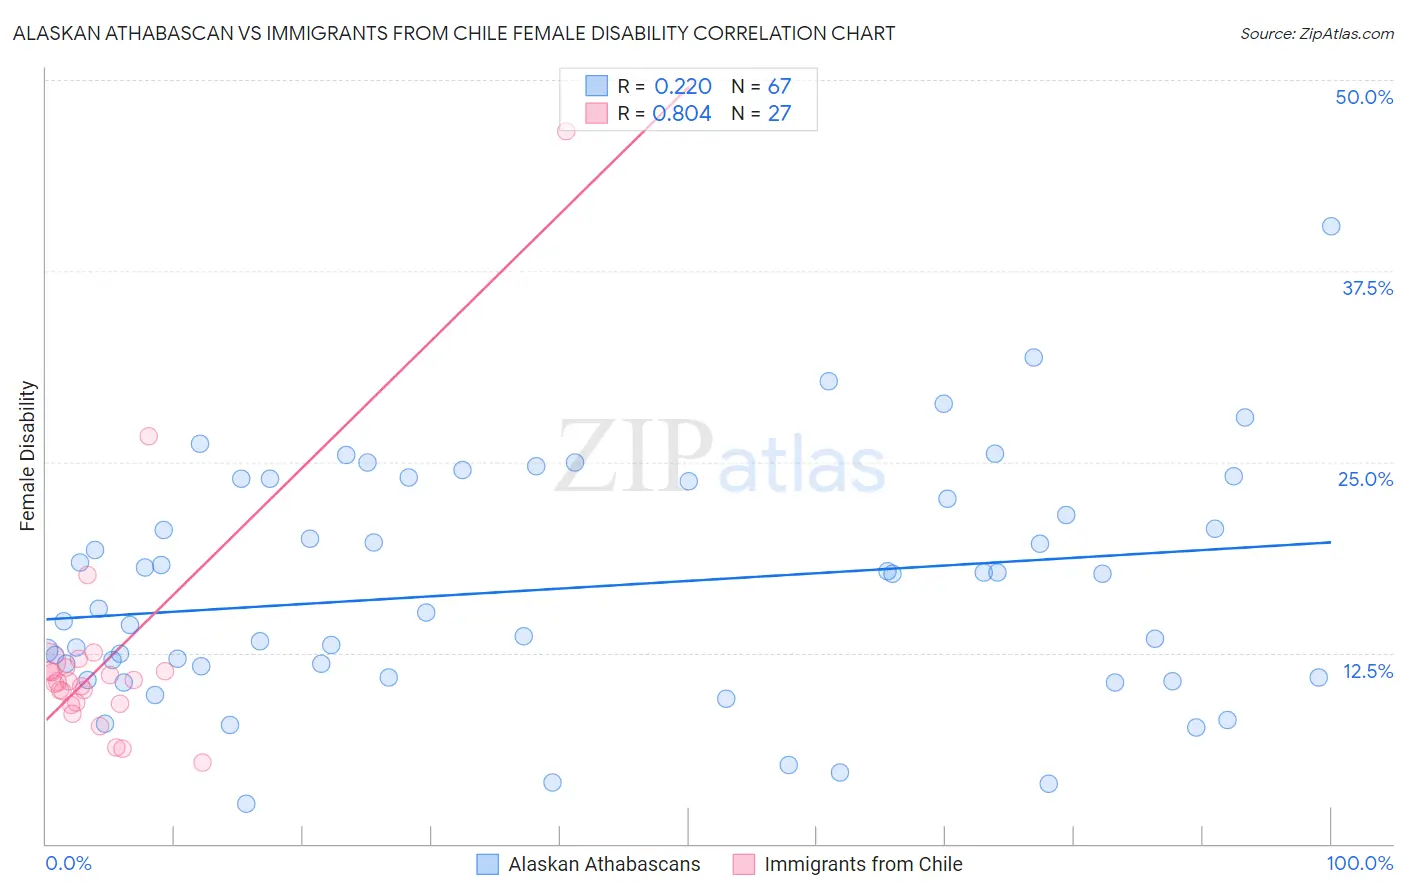
Alaskan Athabascan vs Immigrants from Chile Female Disability Correlation Chart
The statistical analysis conducted on geographies consisting of 45,817,882 people shows a weak positive correlation between the proportion of Alaskan Athabascans and percentage of females with a disability in the United States with a correlation coefficient (R) of 0.220 and weighted average of 13.9%. Similarly, the statistical analysis conducted on geographies consisting of 218,627,850 people shows a very strong positive correlation between the proportion of Immigrants from Chile and percentage of females with a disability in the United States with a correlation coefficient (R) of 0.804 and weighted average of 11.5%, a difference of 21.3%.
Female Disability Correlation Summary
| Measurement | Alaskan Athabascan | Immigrants from Chile |
| Minimum | 2.6% | 5.3% |
| Maximum | 40.4% | 46.7% |
| Range | 37.8% | 41.4% |
| Mean | 16.7% | 12.2% |
| Median | 15.4% | 10.6% |
| Interquartile 25% (IQ1) | 10.9% | 9.2% |
| Interquartile 75% (IQ3) | 23.7% | 11.5% |
| Interquartile Range (IQR) | 12.8% | 2.3% |
| Standard Deviation (Sample) | 7.6% | 7.9% |
| Standard Deviation (Population) | 7.6% | 7.8% |
Similar Demographics by Female Disability
Demographics Similar to Alaskan Athabascans by Female Disability
In terms of female disability, the demographic groups most similar to Alaskan Athabascans are Spanish American (14.0%, a difference of 0.36%), Chippewa (14.0%, a difference of 0.47%), Paiute (14.0%, a difference of 0.58%), Puget Sound Salish (13.8%, a difference of 0.59%), and Blackfeet (13.8%, a difference of 0.69%).
| Demographics | Rating | Rank | Female Disability |
| Cree | 0.0 /100 | #308 | Tragic 13.7% |
| French American Indians | 0.0 /100 | #309 | Tragic 13.7% |
| Apache | 0.0 /100 | #310 | Tragic 13.7% |
| Hopi | 0.0 /100 | #311 | Tragic 13.7% |
| Delaware | 0.0 /100 | #312 | Tragic 13.8% |
| Blackfeet | 0.0 /100 | #313 | Tragic 13.8% |
| Puget Sound Salish | 0.0 /100 | #314 | Tragic 13.8% |
| Alaskan Athabascans | 0.0 /100 | #315 | Tragic 13.9% |
| Spanish Americans | 0.0 /100 | #316 | Tragic 14.0% |
| Chippewa | 0.0 /100 | #317 | Tragic 14.0% |
| Paiute | 0.0 /100 | #318 | Tragic 14.0% |
| Iroquois | 0.0 /100 | #319 | Tragic 14.0% |
| Americans | 0.0 /100 | #320 | Tragic 14.1% |
| Potawatomi | 0.0 /100 | #321 | Tragic 14.1% |
| Pueblo | 0.0 /100 | #322 | Tragic 14.1% |
Demographics Similar to Immigrants from Chile by Female Disability
In terms of female disability, the demographic groups most similar to Immigrants from Chile are Colombian (11.5%, a difference of 0.010%), Immigrants from Ireland (11.5%, a difference of 0.040%), Immigrants from Northern Africa (11.5%, a difference of 0.080%), Immigrants from Vietnam (11.5%, a difference of 0.10%), and Chilean (11.5%, a difference of 0.11%).
| Demographics | Rating | Rank | Female Disability |
| Immigrants | Colombia | 99.9 /100 | #63 | Exceptional 11.4% |
| Immigrants | El Salvador | 99.9 /100 | #64 | Exceptional 11.4% |
| Immigrants | South America | 99.9 /100 | #65 | Exceptional 11.4% |
| Salvadorans | 99.8 /100 | #66 | Exceptional 11.5% |
| Immigrants | Vietnam | 99.8 /100 | #67 | Exceptional 11.5% |
| Immigrants | Northern Africa | 99.8 /100 | #68 | Exceptional 11.5% |
| Colombians | 99.8 /100 | #69 | Exceptional 11.5% |
| Immigrants | Chile | 99.8 /100 | #70 | Exceptional 11.5% |
| Immigrants | Ireland | 99.8 /100 | #71 | Exceptional 11.5% |
| Chileans | 99.8 /100 | #72 | Exceptional 11.5% |
| Immigrants | Switzerland | 99.8 /100 | #73 | Exceptional 11.5% |
| Bhutanese | 99.8 /100 | #74 | Exceptional 11.5% |
| Immigrants | Lebanon | 99.7 /100 | #75 | Exceptional 11.5% |
| Immigrants | Eritrea | 99.7 /100 | #76 | Exceptional 11.5% |
| Immigrants | Afghanistan | 99.7 /100 | #77 | Exceptional 11.5% |