Belgian vs Immigrants from Chile In Labor Force | Age 30-34
COMPARE
Belgian
Immigrants from Chile
In Labor Force | Age 30-34
In Labor Force | Age 30-34 Comparison
Belgians
Immigrants from Chile
85.2%
IN LABOR FORCE | AGE 30-34
97.2/ 100
METRIC RATING
99th/ 347
METRIC RANK
85.0%
IN LABOR FORCE | AGE 30-34
89.2/ 100
METRIC RATING
134th/ 347
METRIC RANK
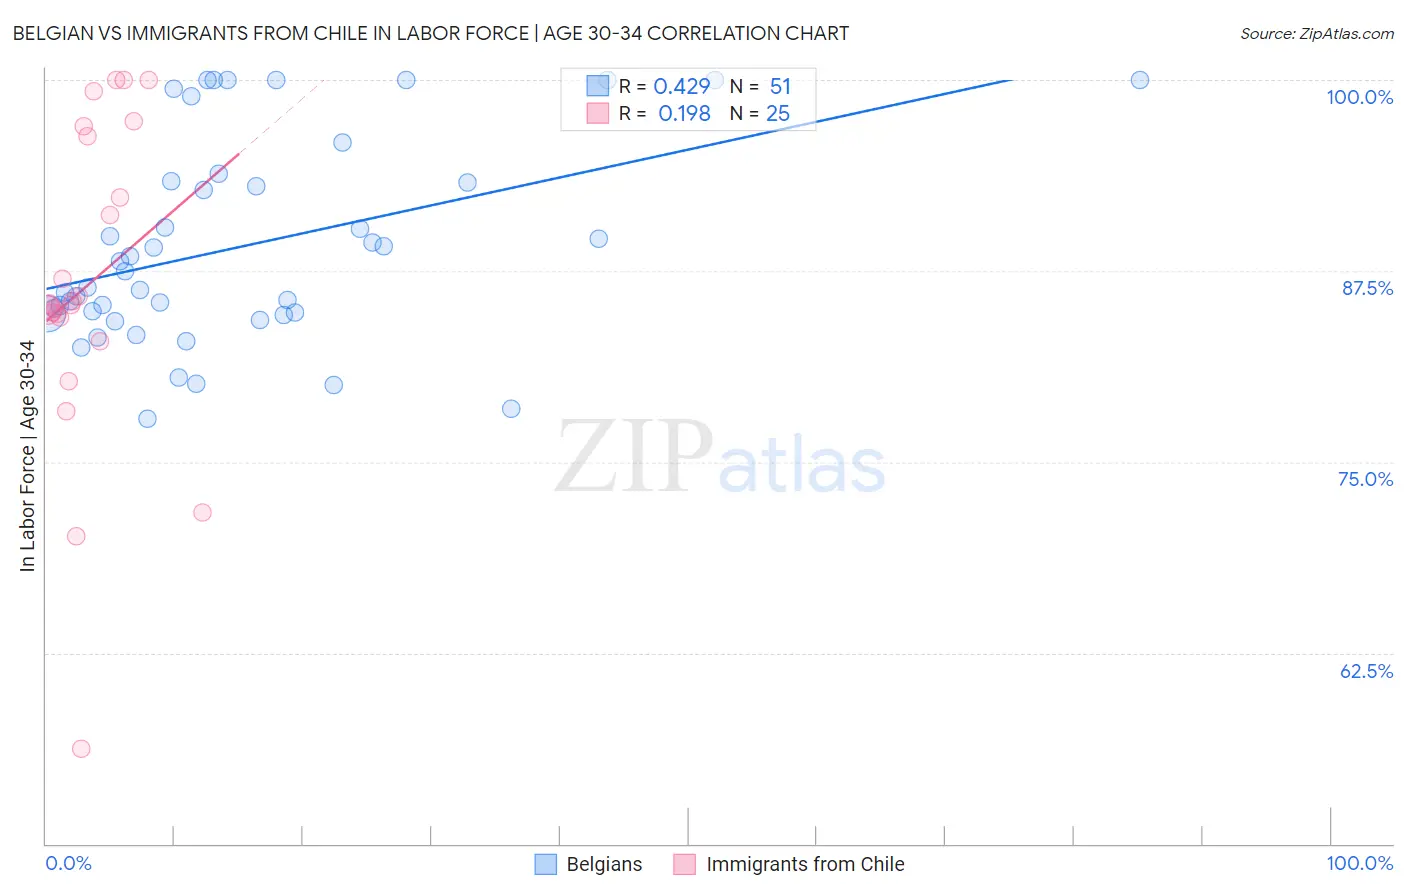
Belgian vs Immigrants from Chile In Labor Force | Age 30-34 Correlation Chart
The statistical analysis conducted on geographies consisting of 355,822,490 people shows a moderate positive correlation between the proportion of Belgians and labor force participation rate among population between the ages 30 and 34 in the United States with a correlation coefficient (R) of 0.429 and weighted average of 85.2%. Similarly, the statistical analysis conducted on geographies consisting of 218,612,214 people shows a poor positive correlation between the proportion of Immigrants from Chile and labor force participation rate among population between the ages 30 and 34 in the United States with a correlation coefficient (R) of 0.198 and weighted average of 85.0%, a difference of 0.25%.
In Labor Force | Age 30-34 Correlation Summary
| Measurement | Belgian | Immigrants from Chile |
| Minimum | 77.8% | 56.2% |
| Maximum | 100.0% | 100.0% |
| Range | 22.2% | 43.8% |
| Mean | 89.1% | 86.6% |
| Median | 87.5% | 85.3% |
| Interquartile 25% (IQ1) | 84.7% | 83.7% |
| Interquartile 75% (IQ3) | 93.3% | 96.6% |
| Interquartile Range (IQR) | 8.6% | 13.0% |
| Standard Deviation (Sample) | 6.6% | 10.5% |
| Standard Deviation (Population) | 6.5% | 10.3% |
Similar Demographics by In Labor Force | Age 30-34
Demographics Similar to Belgians by In Labor Force | Age 30-34
In terms of in labor force | age 30-34, the demographic groups most similar to Belgians are Thai (85.2%, a difference of 0.0%), Immigrants from Uganda (85.2%, a difference of 0.0%), Sudanese (85.2%, a difference of 0.0%), Immigrants from Korea (85.2%, a difference of 0.010%), and Immigrants from Belarus (85.2%, a difference of 0.010%).
| Demographics | Rating | Rank | In Labor Force | Age 30-34 |
| German Russians | 97.7 /100 | #92 | Exceptional 85.2% |
| Immigrants | Norway | 97.6 /100 | #93 | Exceptional 85.2% |
| Swedes | 97.5 /100 | #94 | Exceptional 85.2% |
| Immigrants | India | 97.4 /100 | #95 | Exceptional 85.2% |
| Immigrants | Korea | 97.3 /100 | #96 | Exceptional 85.2% |
| Thais | 97.2 /100 | #97 | Exceptional 85.2% |
| Immigrants | Uganda | 97.2 /100 | #98 | Exceptional 85.2% |
| Belgians | 97.2 /100 | #99 | Exceptional 85.2% |
| Sudanese | 97.1 /100 | #100 | Exceptional 85.2% |
| Immigrants | Belarus | 96.9 /100 | #101 | Exceptional 85.2% |
| Immigrants | Austria | 96.8 /100 | #102 | Exceptional 85.2% |
| Ukrainians | 96.6 /100 | #103 | Exceptional 85.2% |
| Immigrants | Ghana | 96.5 /100 | #104 | Exceptional 85.2% |
| Alsatians | 96.3 /100 | #105 | Exceptional 85.2% |
| Immigrants | Middle Africa | 96.3 /100 | #106 | Exceptional 85.2% |
Demographics Similar to Immigrants from Chile by In Labor Force | Age 30-34
In terms of in labor force | age 30-34, the demographic groups most similar to Immigrants from Chile are Immigrants from Asia (85.0%, a difference of 0.0%), Chinese (85.0%, a difference of 0.010%), Immigrants from Israel (85.0%, a difference of 0.010%), New Zealander (85.0%, a difference of 0.010%), and Jordanian (85.0%, a difference of 0.010%).
| Demographics | Rating | Rank | In Labor Force | Age 30-34 |
| Slavs | 90.7 /100 | #127 | Exceptional 85.0% |
| Immigrants | Argentina | 90.6 /100 | #128 | Exceptional 85.0% |
| Immigrants | Western Africa | 90.2 /100 | #129 | Exceptional 85.0% |
| Immigrants | Spain | 90.0 /100 | #130 | Exceptional 85.0% |
| Chinese | 89.6 /100 | #131 | Excellent 85.0% |
| Immigrants | Israel | 89.5 /100 | #132 | Excellent 85.0% |
| New Zealanders | 89.5 /100 | #133 | Excellent 85.0% |
| Immigrants | Chile | 89.2 /100 | #134 | Excellent 85.0% |
| Immigrants | Asia | 88.9 /100 | #135 | Excellent 85.0% |
| Jordanians | 88.6 /100 | #136 | Excellent 85.0% |
| South Africans | 88.0 /100 | #137 | Excellent 85.0% |
| Sri Lankans | 87.8 /100 | #138 | Excellent 85.0% |
| Bhutanese | 87.5 /100 | #139 | Excellent 85.0% |
| Immigrants | Vietnam | 86.5 /100 | #140 | Excellent 85.0% |
| Chileans | 85.3 /100 | #141 | Excellent 84.9% |