Belgian vs Immigrants from Chile Cognitive Disability
COMPARE
Belgian
Immigrants from Chile
Cognitive Disability
Cognitive Disability Comparison
Belgians
Immigrants from Chile
16.7%
COGNITIVE DISABILITY
99.1/ 100
METRIC RATING
84th/ 347
METRIC RANK
17.0%
COGNITIVE DISABILITY
91.7/ 100
METRIC RATING
134th/ 347
METRIC RANK
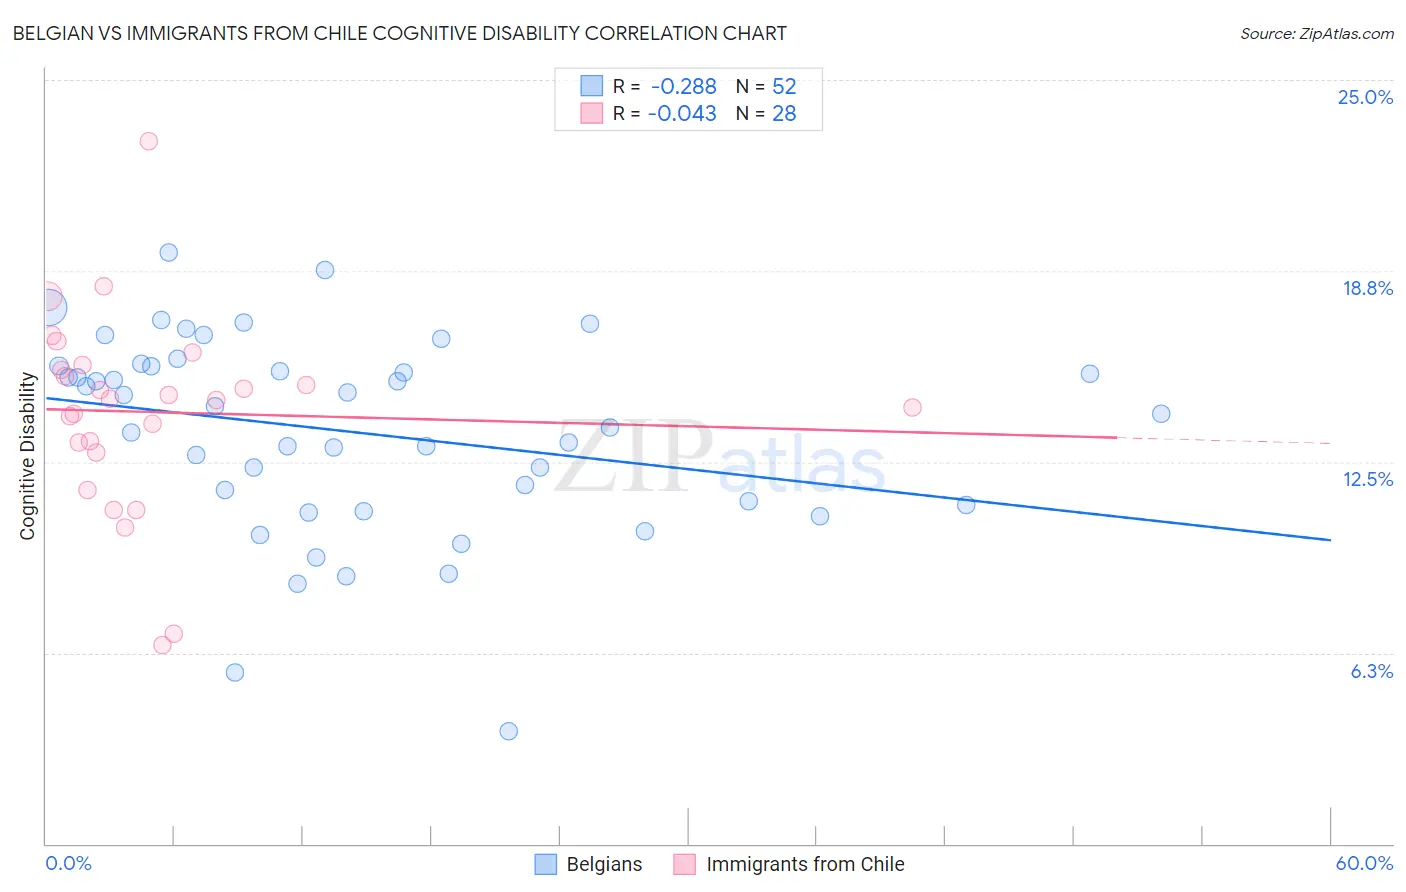
Belgian vs Immigrants from Chile Cognitive Disability Correlation Chart
The statistical analysis conducted on geographies consisting of 355,993,312 people shows a weak negative correlation between the proportion of Belgians and percentage of population with cognitive disability in the United States with a correlation coefficient (R) of -0.288 and weighted average of 16.7%. Similarly, the statistical analysis conducted on geographies consisting of 218,627,878 people shows no correlation between the proportion of Immigrants from Chile and percentage of population with cognitive disability in the United States with a correlation coefficient (R) of -0.043 and weighted average of 17.0%, a difference of 1.7%.
Cognitive Disability Correlation Summary
| Measurement | Belgian | Immigrants from Chile |
| Minimum | 3.7% | 6.5% |
| Maximum | 19.4% | 23.0% |
| Range | 15.7% | 16.5% |
| Mean | 13.5% | 14.1% |
| Median | 14.2% | 14.6% |
| Interquartile 25% (IQ1) | 11.1% | 13.0% |
| Interquartile 75% (IQ3) | 15.6% | 15.6% |
| Interquartile Range (IQR) | 4.5% | 2.6% |
| Standard Deviation (Sample) | 3.2% | 3.3% |
| Standard Deviation (Population) | 3.2% | 3.2% |
Similar Demographics by Cognitive Disability
Demographics Similar to Belgians by Cognitive Disability
In terms of cognitive disability, the demographic groups most similar to Belgians are Serbian (16.7%, a difference of 0.020%), Immigrants from Moldova (16.7%, a difference of 0.020%), Immigrants from South Africa (16.7%, a difference of 0.050%), Native Hawaiian (16.7%, a difference of 0.060%), and Swiss (16.7%, a difference of 0.090%).
| Demographics | Rating | Rank | Cognitive Disability |
| Immigrants | Hungary | 99.3 /100 | #77 | Exceptional 16.7% |
| Peruvians | 99.3 /100 | #78 | Exceptional 16.7% |
| Immigrants | Bulgaria | 99.3 /100 | #79 | Exceptional 16.7% |
| Egyptians | 99.2 /100 | #80 | Exceptional 16.7% |
| Immigrants | Netherlands | 99.2 /100 | #81 | Exceptional 16.7% |
| Swiss | 99.2 /100 | #82 | Exceptional 16.7% |
| Serbians | 99.1 /100 | #83 | Exceptional 16.7% |
| Belgians | 99.1 /100 | #84 | Exceptional 16.7% |
| Immigrants | Moldova | 99.1 /100 | #85 | Exceptional 16.7% |
| Immigrants | South Africa | 99.0 /100 | #86 | Exceptional 16.7% |
| Native Hawaiians | 99.0 /100 | #87 | Exceptional 16.7% |
| Immigrants | Philippines | 99.0 /100 | #88 | Exceptional 16.7% |
| Immigrants | Egypt | 98.8 /100 | #89 | Exceptional 16.7% |
| South Americans | 98.8 /100 | #90 | Exceptional 16.7% |
| Danes | 98.8 /100 | #91 | Exceptional 16.7% |
Demographics Similar to Immigrants from Chile by Cognitive Disability
In terms of cognitive disability, the demographic groups most similar to Immigrants from Chile are Immigrants from Jordan (17.0%, a difference of 0.020%), Immigrants from Germany (17.0%, a difference of 0.040%), White/Caucasian (17.0%, a difference of 0.040%), Lebanese (17.0%, a difference of 0.040%), and Israeli (17.0%, a difference of 0.060%).
| Demographics | Rating | Rank | Cognitive Disability |
| Immigrants | Costa Rica | 93.1 /100 | #127 | Exceptional 17.0% |
| Nicaraguans | 93.0 /100 | #128 | Exceptional 17.0% |
| Immigrants | Uruguay | 92.9 /100 | #129 | Exceptional 17.0% |
| Immigrants | Vietnam | 92.4 /100 | #130 | Exceptional 17.0% |
| Immigrants | Germany | 92.1 /100 | #131 | Exceptional 17.0% |
| Whites/Caucasians | 92.1 /100 | #132 | Exceptional 17.0% |
| Immigrants | Jordan | 91.9 /100 | #133 | Exceptional 17.0% |
| Immigrants | Chile | 91.7 /100 | #134 | Exceptional 17.0% |
| Lebanese | 91.3 /100 | #135 | Exceptional 17.0% |
| Israelis | 91.0 /100 | #136 | Exceptional 17.0% |
| Immigrants | Norway | 90.9 /100 | #137 | Exceptional 17.0% |
| Welsh | 90.8 /100 | #138 | Exceptional 17.0% |
| French | 90.0 /100 | #139 | Excellent 17.0% |
| Chileans | 89.9 /100 | #140 | Excellent 17.0% |
| Aleuts | 89.9 /100 | #141 | Excellent 17.0% |