Basque vs Laotian Female Disability
COMPARE
Basque
Laotian
Female Disability
Female Disability Comparison
Basques
Laotians
12.4%
FEMALE DISABILITY
17.5/ 100
METRIC RATING
208th/ 347
METRIC RANK
11.4%
FEMALE DISABILITY
99.9/ 100
METRIC RATING
58th/ 347
METRIC RANK
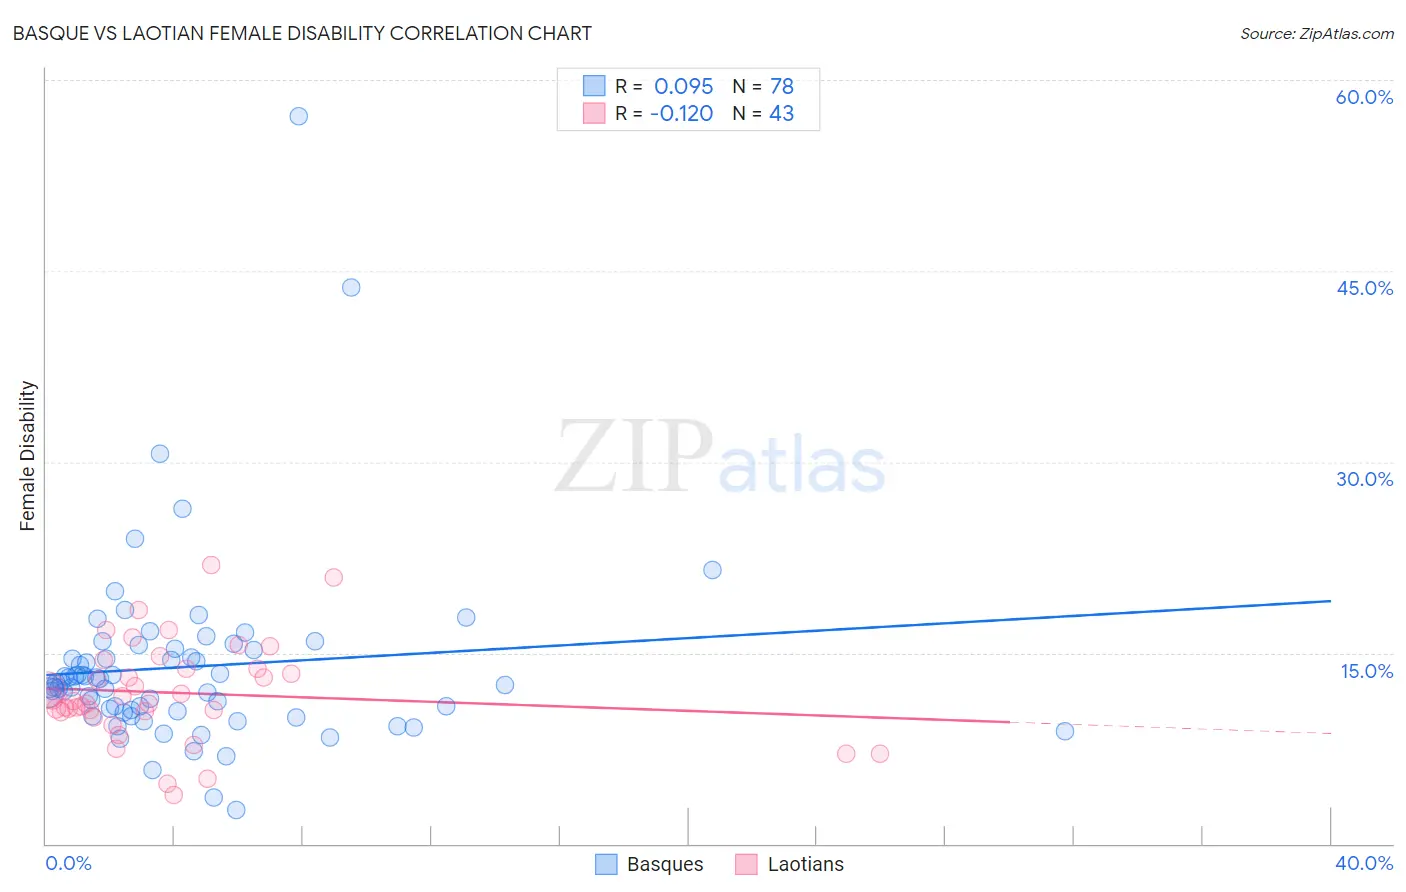
Basque vs Laotian Female Disability Correlation Chart
The statistical analysis conducted on geographies consisting of 165,775,709 people shows a slight positive correlation between the proportion of Basques and percentage of females with a disability in the United States with a correlation coefficient (R) of 0.095 and weighted average of 12.4%. Similarly, the statistical analysis conducted on geographies consisting of 224,852,766 people shows a poor negative correlation between the proportion of Laotians and percentage of females with a disability in the United States with a correlation coefficient (R) of -0.120 and weighted average of 11.4%, a difference of 8.8%.
Female Disability Correlation Summary
| Measurement | Basque | Laotian |
| Minimum | 2.6% | 3.8% |
| Maximum | 57.1% | 21.9% |
| Range | 54.5% | 18.1% |
| Mean | 13.9% | 11.8% |
| Median | 12.6% | 11.2% |
| Interquartile 25% (IQ1) | 10.4% | 10.4% |
| Interquartile 75% (IQ3) | 15.2% | 13.8% |
| Interquartile Range (IQR) | 4.8% | 3.4% |
| Standard Deviation (Sample) | 7.5% | 3.9% |
| Standard Deviation (Population) | 7.4% | 3.8% |
Similar Demographics by Female Disability
Demographics Similar to Basques by Female Disability
In terms of female disability, the demographic groups most similar to Basques are Mexican (12.4%, a difference of 0.12%), Immigrants from Cuba (12.4%, a difference of 0.16%), Croatian (12.4%, a difference of 0.16%), Immigrants from Grenada (12.4%, a difference of 0.18%), and Swiss (12.4%, a difference of 0.18%).
| Demographics | Rating | Rank | Female Disability |
| Chinese | 22.1 /100 | #201 | Fair 12.3% |
| Somalis | 21.5 /100 | #202 | Fair 12.3% |
| Immigrants | Barbados | 21.1 /100 | #203 | Fair 12.3% |
| Immigrants | Zaire | 20.9 /100 | #204 | Fair 12.3% |
| Immigrants | Grenada | 20.5 /100 | #205 | Fair 12.4% |
| Immigrants | Cuba | 20.2 /100 | #206 | Fair 12.4% |
| Croatians | 20.2 /100 | #207 | Fair 12.4% |
| Basques | 17.5 /100 | #208 | Poor 12.4% |
| Mexicans | 15.7 /100 | #209 | Poor 12.4% |
| Swiss | 14.9 /100 | #210 | Poor 12.4% |
| Immigrants | Bosnia and Herzegovina | 14.8 /100 | #211 | Poor 12.4% |
| Ute | 14.7 /100 | #212 | Poor 12.4% |
| Immigrants | Thailand | 14.5 /100 | #213 | Poor 12.4% |
| Panamanians | 13.5 /100 | #214 | Poor 12.4% |
| Samoans | 13.4 /100 | #215 | Poor 12.4% |
Demographics Similar to Laotians by Female Disability
In terms of female disability, the demographic groups most similar to Laotians are South American (11.4%, a difference of 0.020%), Taiwanese (11.4%, a difference of 0.090%), Immigrants from Spain (11.4%, a difference of 0.13%), Immigrants from Bulgaria (11.4%, a difference of 0.25%), and Immigrants from France (11.4%, a difference of 0.31%).
| Demographics | Rating | Rank | Female Disability |
| Immigrants | Belgium | 100.0 /100 | #51 | Exceptional 11.3% |
| Immigrants | Peru | 99.9 /100 | #52 | Exceptional 11.3% |
| Immigrants | Saudi Arabia | 99.9 /100 | #53 | Exceptional 11.3% |
| Peruvians | 99.9 /100 | #54 | Exceptional 11.3% |
| Bulgarians | 99.9 /100 | #55 | Exceptional 11.3% |
| Taiwanese | 99.9 /100 | #56 | Exceptional 11.4% |
| South Americans | 99.9 /100 | #57 | Exceptional 11.4% |
| Laotians | 99.9 /100 | #58 | Exceptional 11.4% |
| Immigrants | Spain | 99.9 /100 | #59 | Exceptional 11.4% |
| Immigrants | Bulgaria | 99.9 /100 | #60 | Exceptional 11.4% |
| Immigrants | France | 99.9 /100 | #61 | Exceptional 11.4% |
| Sri Lankans | 99.9 /100 | #62 | Exceptional 11.4% |
| Immigrants | Colombia | 99.9 /100 | #63 | Exceptional 11.4% |
| Immigrants | El Salvador | 99.9 /100 | #64 | Exceptional 11.4% |
| Immigrants | South America | 99.9 /100 | #65 | Exceptional 11.4% |