Barbadian vs Shoshone Female Disability
COMPARE
Barbadian
Shoshone
Female Disability
Female Disability Comparison
Barbadians
Shoshone
12.6%
FEMALE DISABILITY
3.6/ 100
METRIC RATING
239th/ 347
METRIC RANK
13.2%
FEMALE DISABILITY
0.0/ 100
METRIC RATING
291st/ 347
METRIC RANK
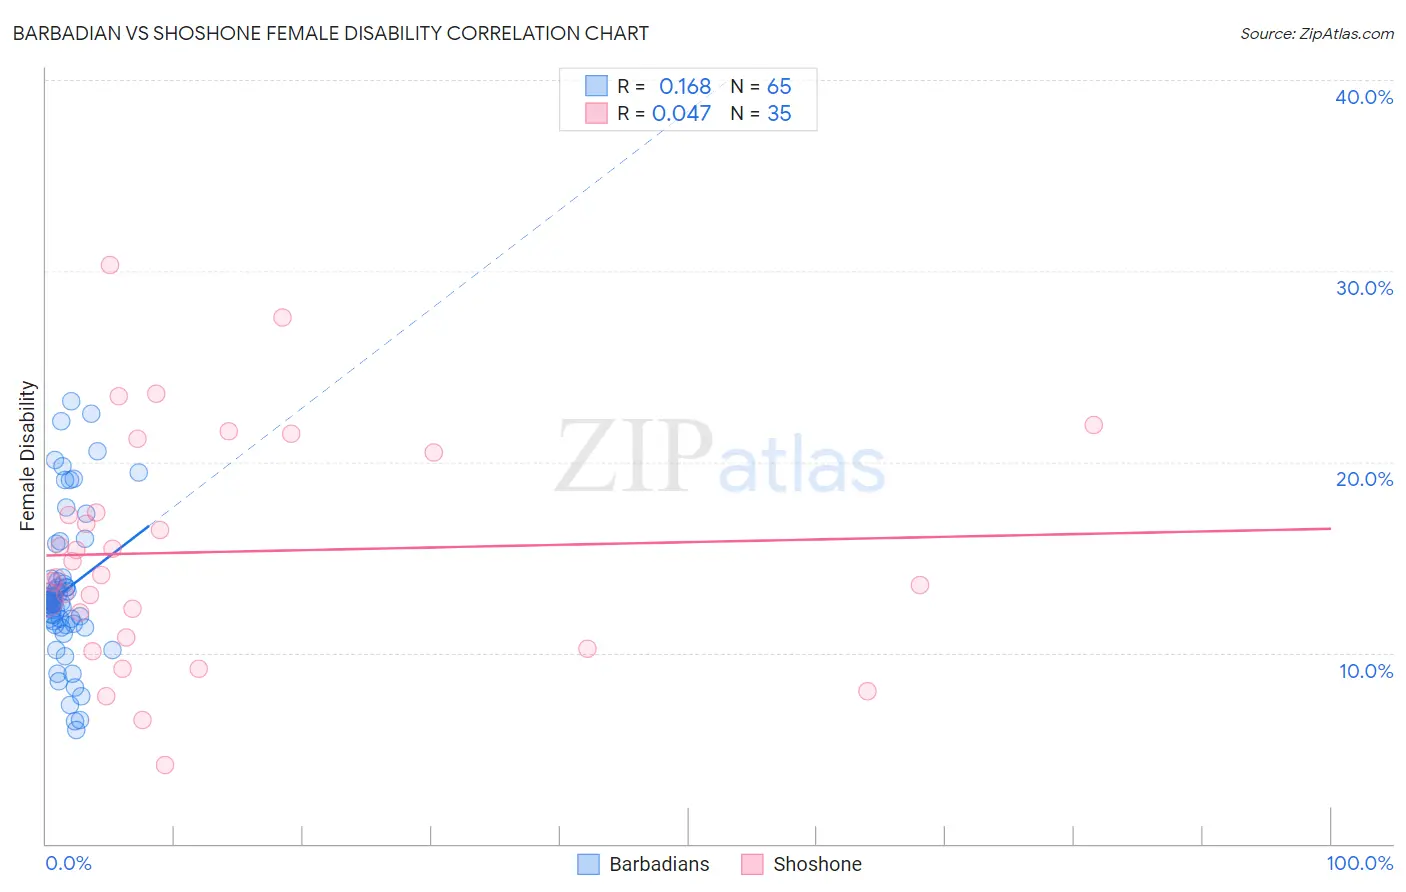
Barbadian vs Shoshone Female Disability Correlation Chart
The statistical analysis conducted on geographies consisting of 141,302,135 people shows a poor positive correlation between the proportion of Barbadians and percentage of females with a disability in the United States with a correlation coefficient (R) of 0.168 and weighted average of 12.6%. Similarly, the statistical analysis conducted on geographies consisting of 66,617,208 people shows no correlation between the proportion of Shoshone and percentage of females with a disability in the United States with a correlation coefficient (R) of 0.047 and weighted average of 13.2%, a difference of 5.1%.
Female Disability Correlation Summary
| Measurement | Barbadian | Shoshone |
| Minimum | 5.9% | 4.1% |
| Maximum | 23.2% | 30.3% |
| Range | 17.2% | 26.2% |
| Mean | 13.3% | 15.3% |
| Median | 12.6% | 14.1% |
| Interquartile 25% (IQ1) | 11.5% | 10.8% |
| Interquartile 75% (IQ3) | 13.9% | 20.5% |
| Interquartile Range (IQR) | 2.4% | 9.7% |
| Standard Deviation (Sample) | 3.9% | 6.0% |
| Standard Deviation (Population) | 3.9% | 5.9% |
Similar Demographics by Female Disability
Demographics Similar to Barbadians by Female Disability
In terms of female disability, the demographic groups most similar to Barbadians are Yugoslavian (12.6%, a difference of 0.030%), Slavic (12.6%, a difference of 0.060%), German Russian (12.6%, a difference of 0.090%), Immigrants from West Indies (12.6%, a difference of 0.19%), and Japanese (12.6%, a difference of 0.26%).
| Demographics | Rating | Rank | Female Disability |
| Immigrants | Somalia | 5.9 /100 | #232 | Tragic 12.5% |
| Immigrants | Iraq | 5.3 /100 | #233 | Tragic 12.5% |
| Scandinavians | 5.3 /100 | #234 | Tragic 12.5% |
| Malaysians | 5.0 /100 | #235 | Tragic 12.5% |
| Immigrants | West Indies | 4.4 /100 | #236 | Tragic 12.6% |
| Slavs | 3.8 /100 | #237 | Tragic 12.6% |
| Yugoslavians | 3.7 /100 | #238 | Tragic 12.6% |
| Barbadians | 3.6 /100 | #239 | Tragic 12.6% |
| German Russians | 3.2 /100 | #240 | Tragic 12.6% |
| Japanese | 2.7 /100 | #241 | Tragic 12.6% |
| Canadians | 2.6 /100 | #242 | Tragic 12.6% |
| Immigrants | Senegal | 2.5 /100 | #243 | Tragic 12.6% |
| Alsatians | 2.5 /100 | #244 | Tragic 12.6% |
| Immigrants | Jamaica | 2.2 /100 | #245 | Tragic 12.6% |
| Spanish American Indians | 2.1 /100 | #246 | Tragic 12.6% |
Demographics Similar to Shoshone by Female Disability
In terms of female disability, the demographic groups most similar to Shoshone are Tlingit-Haida (13.2%, a difference of 0.060%), Immigrants from Yemen (13.2%, a difference of 0.060%), Yakama (13.2%, a difference of 0.17%), White/Caucasian (13.2%, a difference of 0.24%), and Yaqui (13.2%, a difference of 0.34%).
| Demographics | Rating | Rank | Female Disability |
| Hmong | 0.0 /100 | #284 | Tragic 13.1% |
| Bangladeshis | 0.0 /100 | #285 | Tragic 13.1% |
| Fijians | 0.0 /100 | #286 | Tragic 13.1% |
| Yaqui | 0.0 /100 | #287 | Tragic 13.2% |
| Whites/Caucasians | 0.0 /100 | #288 | Tragic 13.2% |
| Tlingit-Haida | 0.0 /100 | #289 | Tragic 13.2% |
| Immigrants | Yemen | 0.0 /100 | #290 | Tragic 13.2% |
| Shoshone | 0.0 /100 | #291 | Tragic 13.2% |
| Yakama | 0.0 /100 | #292 | Tragic 13.2% |
| Marshallese | 0.0 /100 | #293 | Tragic 13.3% |
| Celtics | 0.0 /100 | #294 | Tragic 13.3% |
| French | 0.0 /100 | #295 | Tragic 13.3% |
| Nepalese | 0.0 /100 | #296 | Tragic 13.3% |
| Slovaks | 0.0 /100 | #297 | Tragic 13.3% |
| Immigrants | Nonimmigrants | 0.0 /100 | #298 | Tragic 13.4% |