Barbadian vs Shoshone Median Female Earnings
COMPARE
Barbadian
Shoshone
Median Female Earnings
Median Female Earnings Comparison
Barbadians
Shoshone
$41,261
MEDIAN FEMALE EARNINGS
96.3/ 100
METRIC RATING
117th/ 347
METRIC RANK
$34,677
MEDIAN FEMALE EARNINGS
0.0/ 100
METRIC RATING
319th/ 347
METRIC RANK
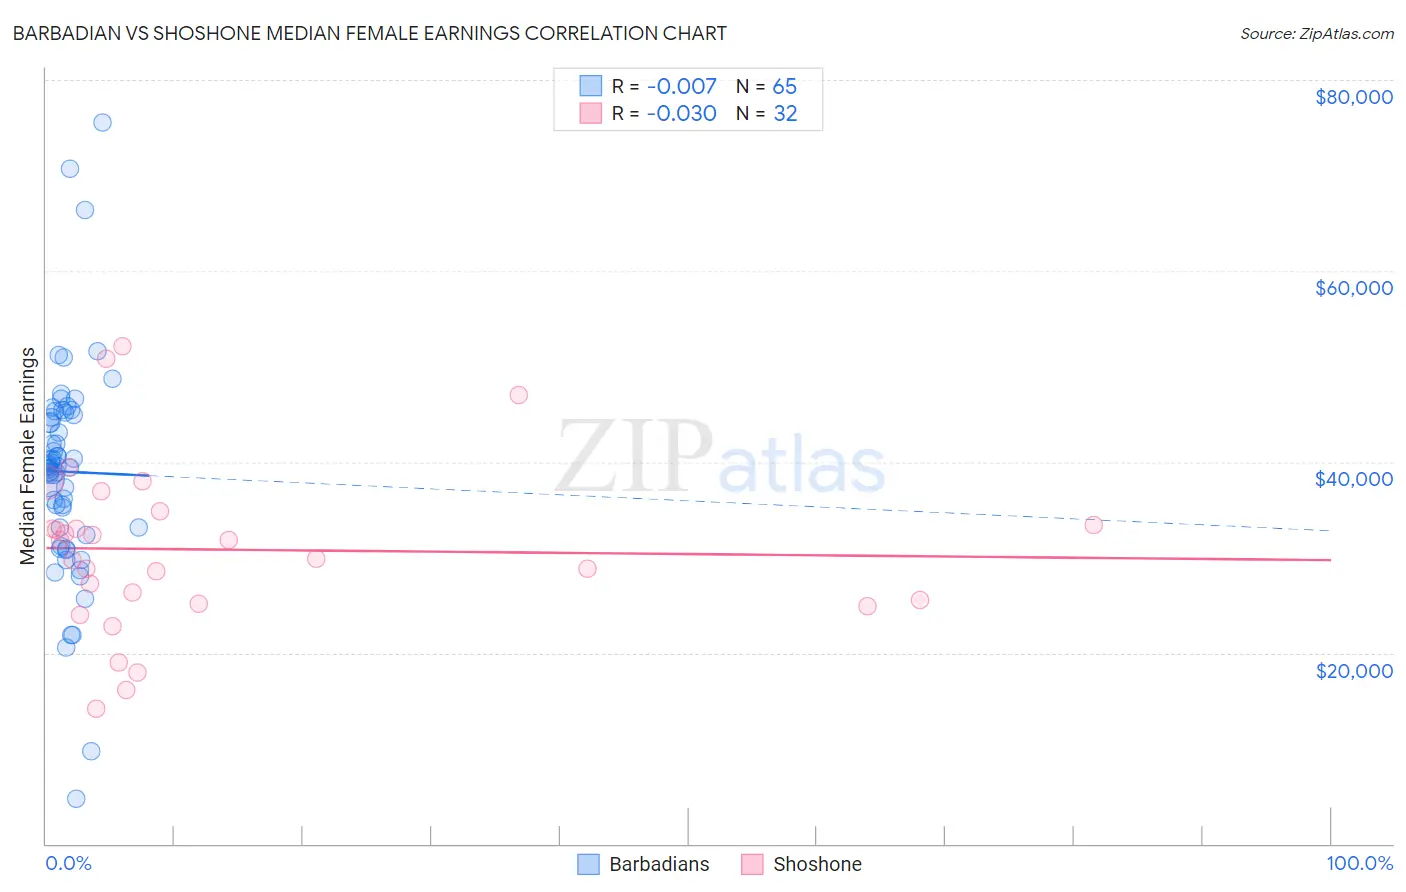
Barbadian vs Shoshone Median Female Earnings Correlation Chart
The statistical analysis conducted on geographies consisting of 141,295,506 people shows no correlation between the proportion of Barbadians and median female earnings in the United States with a correlation coefficient (R) of -0.007 and weighted average of $41,261. Similarly, the statistical analysis conducted on geographies consisting of 66,610,433 people shows no correlation between the proportion of Shoshone and median female earnings in the United States with a correlation coefficient (R) of -0.030 and weighted average of $34,677, a difference of 19.0%.
Median Female Earnings Correlation Summary
| Measurement | Barbadian | Shoshone |
| Minimum | $4,682 | $14,091 |
| Maximum | $75,551 | $52,089 |
| Range | $70,869 | $37,998 |
| Mean | $38,965 | $30,807 |
| Median | $39,507 | $30,799 |
| Interquartile 25% (IQ1) | $32,736 | $25,287 |
| Interquartile 75% (IQ3) | $45,058 | $34,049 |
| Interquartile Range (IQR) | $12,323 | $8,762 |
| Standard Deviation (Sample) | $11,409 | $8,852 |
| Standard Deviation (Population) | $11,321 | $8,713 |
Similar Demographics by Median Female Earnings
Demographics Similar to Barbadians by Median Female Earnings
In terms of median female earnings, the demographic groups most similar to Barbadians are Immigrants from Brazil ($41,273, a difference of 0.030%), Immigrants from England ($41,277, a difference of 0.040%), Korean ($41,276, a difference of 0.040%), Macedonian ($41,286, a difference of 0.060%), and Immigrants from North America ($41,319, a difference of 0.14%).
| Demographics | Rating | Rank | Median Female Earnings |
| Immigrants | Western Asia | 97.0 /100 | #110 | Exceptional $41,375 |
| Immigrants | Canada | 97.0 /100 | #111 | Exceptional $41,373 |
| Immigrants | North America | 96.7 /100 | #112 | Exceptional $41,319 |
| Macedonians | 96.4 /100 | #113 | Exceptional $41,286 |
| Immigrants | England | 96.4 /100 | #114 | Exceptional $41,277 |
| Koreans | 96.4 /100 | #115 | Exceptional $41,276 |
| Immigrants | Brazil | 96.4 /100 | #116 | Exceptional $41,273 |
| Barbadians | 96.3 /100 | #117 | Exceptional $41,261 |
| Immigrants | Lebanon | 95.6 /100 | #118 | Exceptional $41,183 |
| Immigrants | Philippines | 95.0 /100 | #119 | Exceptional $41,114 |
| Immigrants | Kuwait | 94.4 /100 | #120 | Exceptional $41,055 |
| Croatians | 93.7 /100 | #121 | Exceptional $40,993 |
| Immigrants | Jordan | 93.5 /100 | #122 | Exceptional $40,977 |
| Guyanese | 93.4 /100 | #123 | Exceptional $40,973 |
| Trinidadians and Tobagonians | 93.2 /100 | #124 | Exceptional $40,958 |
Demographics Similar to Shoshone by Median Female Earnings
In terms of median female earnings, the demographic groups most similar to Shoshone are Immigrants from Yemen ($34,693, a difference of 0.050%), Immigrants from Honduras ($34,647, a difference of 0.090%), Potawatomi ($34,739, a difference of 0.18%), Cherokee ($34,742, a difference of 0.19%), and Pennsylvania German ($34,802, a difference of 0.36%).
| Demographics | Rating | Rank | Median Female Earnings |
| Yaqui | 0.0 /100 | #312 | Tragic $34,943 |
| Cubans | 0.0 /100 | #313 | Tragic $34,942 |
| Apache | 0.0 /100 | #314 | Tragic $34,895 |
| Pennsylvania Germans | 0.0 /100 | #315 | Tragic $34,802 |
| Cherokee | 0.0 /100 | #316 | Tragic $34,742 |
| Potawatomi | 0.0 /100 | #317 | Tragic $34,739 |
| Immigrants | Yemen | 0.0 /100 | #318 | Tragic $34,693 |
| Shoshone | 0.0 /100 | #319 | Tragic $34,677 |
| Immigrants | Honduras | 0.0 /100 | #320 | Tragic $34,647 |
| Hispanics or Latinos | 0.0 /100 | #321 | Tragic $34,421 |
| Chickasaw | 0.0 /100 | #322 | Tragic $34,414 |
| Seminole | 0.0 /100 | #323 | Tragic $34,385 |
| Immigrants | Congo | 0.0 /100 | #324 | Tragic $34,317 |
| Dutch West Indians | 0.0 /100 | #325 | Tragic $34,106 |
| Kiowa | 0.0 /100 | #326 | Tragic $34,074 |