Turkish vs Shoshone Female Disability
COMPARE
Turkish
Shoshone
Female Disability
Female Disability Comparison
Turks
Shoshone
11.1%
FEMALE DISABILITY
100.0/ 100
METRIC RATING
30th/ 347
METRIC RANK
13.2%
FEMALE DISABILITY
0.0/ 100
METRIC RATING
291st/ 347
METRIC RANK
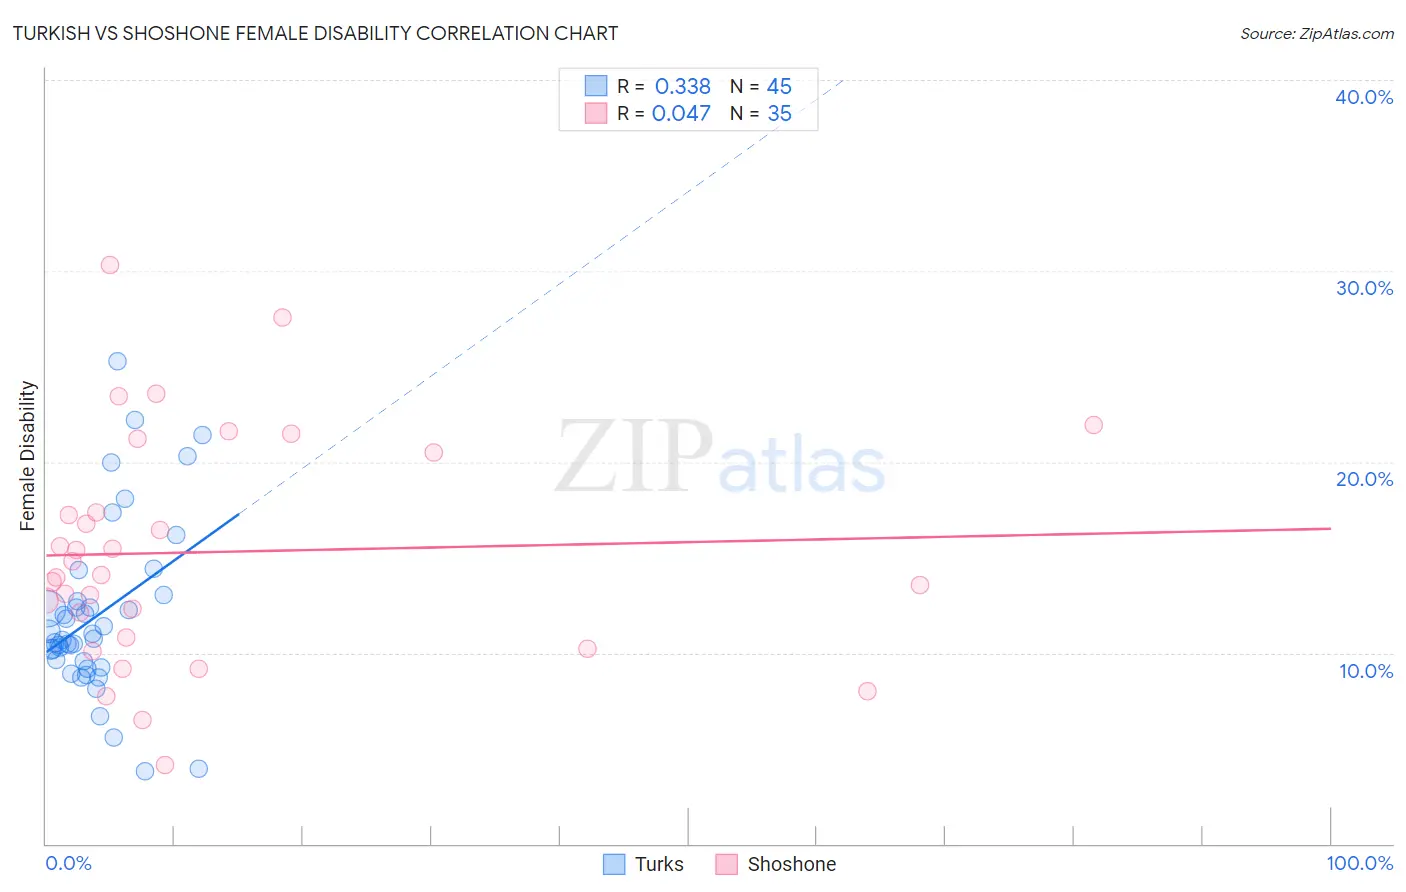
Turkish vs Shoshone Female Disability Correlation Chart
The statistical analysis conducted on geographies consisting of 271,848,470 people shows a mild positive correlation between the proportion of Turks and percentage of females with a disability in the United States with a correlation coefficient (R) of 0.338 and weighted average of 11.1%. Similarly, the statistical analysis conducted on geographies consisting of 66,617,208 people shows no correlation between the proportion of Shoshone and percentage of females with a disability in the United States with a correlation coefficient (R) of 0.047 and weighted average of 13.2%, a difference of 19.0%.
Female Disability Correlation Summary
| Measurement | Turkish | Shoshone |
| Minimum | 3.8% | 4.1% |
| Maximum | 25.3% | 30.3% |
| Range | 21.5% | 26.2% |
| Mean | 12.0% | 15.3% |
| Median | 10.7% | 14.1% |
| Interquartile 25% (IQ1) | 9.4% | 10.8% |
| Interquartile 75% (IQ3) | 12.8% | 20.5% |
| Interquartile Range (IQR) | 3.5% | 9.7% |
| Standard Deviation (Sample) | 4.5% | 6.0% |
| Standard Deviation (Population) | 4.5% | 5.9% |
Similar Demographics by Female Disability
Demographics Similar to Turks by Female Disability
In terms of female disability, the demographic groups most similar to Turks are Immigrants from Malaysia (11.1%, a difference of 0.0%), Egyptian (11.1%, a difference of 0.070%), Immigrants from Kuwait (11.1%, a difference of 0.10%), Immigrants from Australia (11.1%, a difference of 0.27%), and Immigrants from Turkey (11.1%, a difference of 0.34%).
| Demographics | Rating | Rank | Female Disability |
| Venezuelans | 100.0 /100 | #23 | Exceptional 11.0% |
| Immigrants | Argentina | 100.0 /100 | #24 | Exceptional 11.0% |
| Immigrants | Asia | 100.0 /100 | #25 | Exceptional 11.0% |
| Argentineans | 100.0 /100 | #26 | Exceptional 11.0% |
| Immigrants | Turkey | 100.0 /100 | #27 | Exceptional 11.1% |
| Egyptians | 100.0 /100 | #28 | Exceptional 11.1% |
| Immigrants | Malaysia | 100.0 /100 | #29 | Exceptional 11.1% |
| Turks | 100.0 /100 | #30 | Exceptional 11.1% |
| Immigrants | Kuwait | 100.0 /100 | #31 | Exceptional 11.1% |
| Immigrants | Australia | 100.0 /100 | #32 | Exceptional 11.1% |
| Immigrants | Egypt | 100.0 /100 | #33 | Exceptional 11.1% |
| Immigrants | Indonesia | 100.0 /100 | #34 | Exceptional 11.2% |
| Immigrants | Japan | 100.0 /100 | #35 | Exceptional 11.2% |
| Cypriots | 100.0 /100 | #36 | Exceptional 11.2% |
| Ethiopians | 100.0 /100 | #37 | Exceptional 11.2% |
Demographics Similar to Shoshone by Female Disability
In terms of female disability, the demographic groups most similar to Shoshone are Tlingit-Haida (13.2%, a difference of 0.060%), Immigrants from Yemen (13.2%, a difference of 0.060%), Yakama (13.2%, a difference of 0.17%), White/Caucasian (13.2%, a difference of 0.24%), and Yaqui (13.2%, a difference of 0.34%).
| Demographics | Rating | Rank | Female Disability |
| Hmong | 0.0 /100 | #284 | Tragic 13.1% |
| Bangladeshis | 0.0 /100 | #285 | Tragic 13.1% |
| Fijians | 0.0 /100 | #286 | Tragic 13.1% |
| Yaqui | 0.0 /100 | #287 | Tragic 13.2% |
| Whites/Caucasians | 0.0 /100 | #288 | Tragic 13.2% |
| Tlingit-Haida | 0.0 /100 | #289 | Tragic 13.2% |
| Immigrants | Yemen | 0.0 /100 | #290 | Tragic 13.2% |
| Shoshone | 0.0 /100 | #291 | Tragic 13.2% |
| Yakama | 0.0 /100 | #292 | Tragic 13.2% |
| Marshallese | 0.0 /100 | #293 | Tragic 13.3% |
| Celtics | 0.0 /100 | #294 | Tragic 13.3% |
| French | 0.0 /100 | #295 | Tragic 13.3% |
| Nepalese | 0.0 /100 | #296 | Tragic 13.3% |
| Slovaks | 0.0 /100 | #297 | Tragic 13.3% |
| Immigrants | Nonimmigrants | 0.0 /100 | #298 | Tragic 13.4% |