Immigrants from Uruguay vs Immigrants from Peru Disability
COMPARE
Immigrants from Uruguay
Immigrants from Peru
Disability
Disability Comparison
Immigrants from Uruguay
Immigrants from Peru
11.3%
DISABILITY
96.4/ 100
METRIC RATING
103rd/ 347
METRIC RANK
10.8%
DISABILITY
99.9/ 100
METRIC RATING
45th/ 347
METRIC RANK
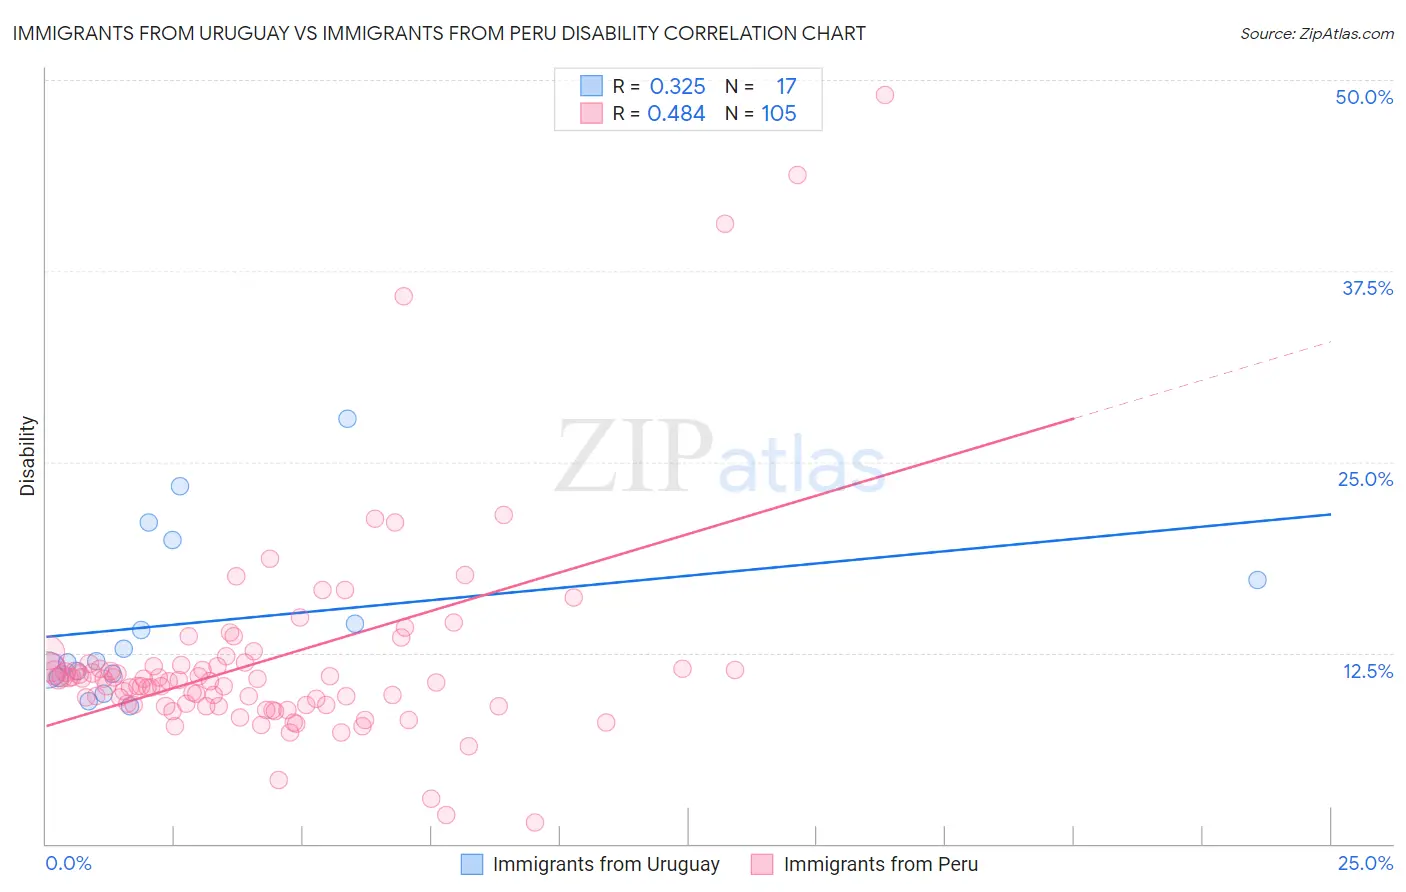
Immigrants from Uruguay vs Immigrants from Peru Disability Correlation Chart
The statistical analysis conducted on geographies consisting of 133,256,548 people shows a mild positive correlation between the proportion of Immigrants from Uruguay and percentage of population with a disability in the United States with a correlation coefficient (R) of 0.325 and weighted average of 11.3%. Similarly, the statistical analysis conducted on geographies consisting of 328,839,266 people shows a moderate positive correlation between the proportion of Immigrants from Peru and percentage of population with a disability in the United States with a correlation coefficient (R) of 0.484 and weighted average of 10.8%, a difference of 4.1%.
Disability Correlation Summary
| Measurement | Immigrants from Uruguay | Immigrants from Peru |
| Minimum | 9.0% | 1.4% |
| Maximum | 27.9% | 49.0% |
| Range | 18.8% | 47.6% |
| Mean | 14.5% | 12.0% |
| Median | 12.0% | 10.7% |
| Interquartile 25% (IQ1) | 11.0% | 9.1% |
| Interquartile 75% (IQ3) | 18.6% | 11.7% |
| Interquartile Range (IQR) | 7.6% | 2.6% |
| Standard Deviation (Sample) | 5.5% | 7.0% |
| Standard Deviation (Population) | 5.3% | 6.9% |
Similar Demographics by Disability
Demographics Similar to Immigrants from Uruguay by Disability
In terms of disability, the demographic groups most similar to Immigrants from Uruguay are Immigrants (11.3%, a difference of 0.010%), Immigrants from Kazakhstan (11.3%, a difference of 0.020%), Immigrants from Eastern Europe (11.3%, a difference of 0.040%), Nicaraguan (11.3%, a difference of 0.060%), and Immigrants from Eastern Africa (11.3%, a difference of 0.070%).
| Demographics | Rating | Rank | Disability |
| Immigrants | Zimbabwe | 97.7 /100 | #96 | Exceptional 11.2% |
| Bhutanese | 97.4 /100 | #97 | Exceptional 11.2% |
| Uruguayans | 97.4 /100 | #98 | Exceptional 11.2% |
| Immigrants | Czechoslovakia | 97.4 /100 | #99 | Exceptional 11.2% |
| Immigrants | Greece | 96.9 /100 | #100 | Exceptional 11.3% |
| Immigrants | Nicaragua | 96.8 /100 | #101 | Exceptional 11.3% |
| Immigrants | Eastern Africa | 96.7 /100 | #102 | Exceptional 11.3% |
| Immigrants | Uruguay | 96.4 /100 | #103 | Exceptional 11.3% |
| Immigrants | Immigrants | 96.4 /100 | #104 | Exceptional 11.3% |
| Immigrants | Kazakhstan | 96.4 /100 | #105 | Exceptional 11.3% |
| Immigrants | Eastern Europe | 96.3 /100 | #106 | Exceptional 11.3% |
| Nicaraguans | 96.2 /100 | #107 | Exceptional 11.3% |
| Immigrants | Nigeria | 96.0 /100 | #108 | Exceptional 11.3% |
| Immigrants | Uganda | 95.7 /100 | #109 | Exceptional 11.3% |
| Immigrants | Denmark | 95.6 /100 | #110 | Exceptional 11.3% |
Demographics Similar to Immigrants from Peru by Disability
In terms of disability, the demographic groups most similar to Immigrants from Peru are Tongan (10.8%, a difference of 0.010%), Taiwanese (10.8%, a difference of 0.020%), Soviet Union (10.9%, a difference of 0.21%), Vietnamese (10.9%, a difference of 0.27%), and Immigrants from Saudi Arabia (10.9%, a difference of 0.27%).
| Demographics | Rating | Rank | Disability |
| Afghans | 99.9 /100 | #38 | Exceptional 10.8% |
| Cambodians | 99.9 /100 | #39 | Exceptional 10.8% |
| Mongolians | 99.9 /100 | #40 | Exceptional 10.8% |
| Immigrants | Australia | 99.9 /100 | #41 | Exceptional 10.8% |
| Immigrants | Nepal | 99.9 /100 | #42 | Exceptional 10.8% |
| Israelis | 99.9 /100 | #43 | Exceptional 10.8% |
| Immigrants | Japan | 99.9 /100 | #44 | Exceptional 10.8% |
| Immigrants | Peru | 99.9 /100 | #45 | Exceptional 10.8% |
| Tongans | 99.9 /100 | #46 | Exceptional 10.8% |
| Taiwanese | 99.9 /100 | #47 | Exceptional 10.8% |
| Soviet Union | 99.9 /100 | #48 | Exceptional 10.9% |
| Vietnamese | 99.9 /100 | #49 | Exceptional 10.9% |
| Immigrants | Saudi Arabia | 99.9 /100 | #50 | Exceptional 10.9% |
| Peruvians | 99.8 /100 | #51 | Exceptional 10.9% |
| South Americans | 99.8 /100 | #52 | Exceptional 10.9% |