Austrian vs Immigrants from Malaysia 8th Grade
COMPARE
Austrian
Immigrants from Malaysia
8th Grade
8th Grade Comparison
Austrians
Immigrants from Malaysia
96.7%
8TH GRADE
99.9/ 100
METRIC RATING
53rd/ 347
METRIC RANK
95.3%
8TH GRADE
7.3/ 100
METRIC RATING
222nd/ 347
METRIC RANK
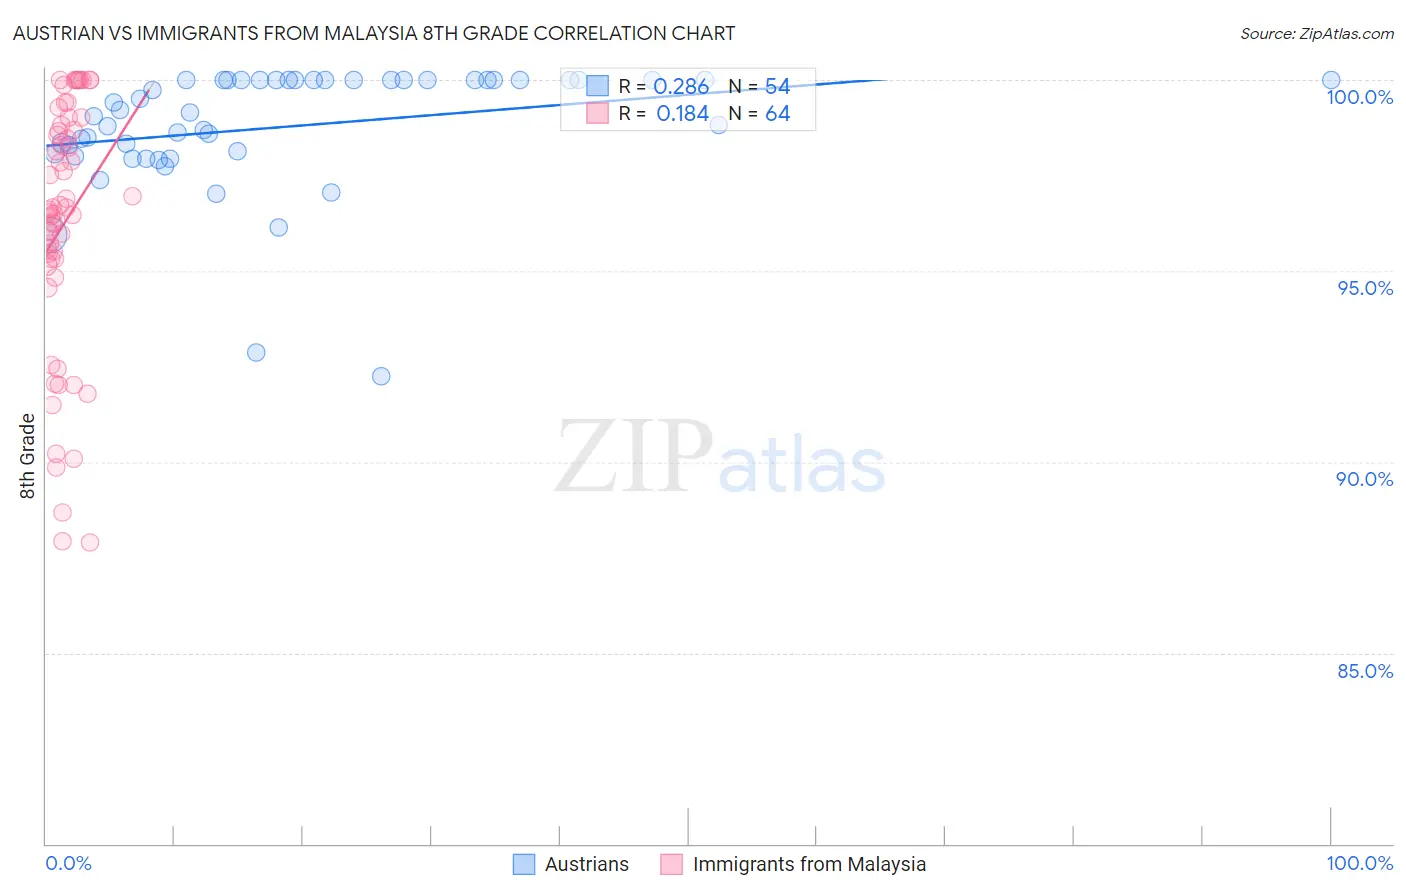
Austrian vs Immigrants from Malaysia 8th Grade Correlation Chart
The statistical analysis conducted on geographies consisting of 452,083,231 people shows a weak positive correlation between the proportion of Austrians and percentage of population with at least 8th grade education in the United States with a correlation coefficient (R) of 0.286 and weighted average of 96.7%. Similarly, the statistical analysis conducted on geographies consisting of 197,973,854 people shows a poor positive correlation between the proportion of Immigrants from Malaysia and percentage of population with at least 8th grade education in the United States with a correlation coefficient (R) of 0.184 and weighted average of 95.3%, a difference of 1.5%.
8th Grade Correlation Summary
| Measurement | Austrian | Immigrants from Malaysia |
| Minimum | 92.3% | 87.9% |
| Maximum | 100.0% | 100.0% |
| Range | 7.7% | 12.1% |
| Mean | 98.8% | 96.2% |
| Median | 99.2% | 96.6% |
| Interquartile 25% (IQ1) | 98.1% | 95.2% |
| Interquartile 75% (IQ3) | 100.0% | 98.8% |
| Interquartile Range (IQR) | 1.9% | 3.5% |
| Standard Deviation (Sample) | 1.6% | 3.3% |
| Standard Deviation (Population) | 1.6% | 3.3% |
Similar Demographics by 8th Grade
Demographics Similar to Austrians by 8th Grade
In terms of 8th grade, the demographic groups most similar to Austrians are Serbian (96.7%, a difference of 0.010%), Russian (96.7%, a difference of 0.010%), Australian (96.7%, a difference of 0.010%), Macedonian (96.7%, a difference of 0.010%), and Greek (96.8%, a difference of 0.020%).
| Demographics | Rating | Rank | 8th Grade |
| Czechoslovakians | 99.9 /100 | #46 | Exceptional 96.9% |
| Bulgarians | 99.9 /100 | #47 | Exceptional 96.9% |
| Slavs | 99.9 /100 | #48 | Exceptional 96.8% |
| Estonians | 99.9 /100 | #49 | Exceptional 96.8% |
| Immigrants | Scotland | 99.9 /100 | #50 | Exceptional 96.8% |
| Celtics | 99.9 /100 | #51 | Exceptional 96.8% |
| Greeks | 99.9 /100 | #52 | Exceptional 96.8% |
| Austrians | 99.9 /100 | #53 | Exceptional 96.7% |
| Serbians | 99.8 /100 | #54 | Exceptional 96.7% |
| Russians | 99.8 /100 | #55 | Exceptional 96.7% |
| Australians | 99.8 /100 | #56 | Exceptional 96.7% |
| Macedonians | 99.8 /100 | #57 | Exceptional 96.7% |
| Immigrants | Canada | 99.8 /100 | #58 | Exceptional 96.7% |
| Immigrants | North America | 99.8 /100 | #59 | Exceptional 96.7% |
| Immigrants | Northern Europe | 99.8 /100 | #60 | Exceptional 96.7% |
Demographics Similar to Immigrants from Malaysia by 8th Grade
In terms of 8th grade, the demographic groups most similar to Immigrants from Malaysia are Immigrants from Syria (95.3%, a difference of 0.0%), Immigrants from Oceania (95.3%, a difference of 0.0%), Immigrants from Southern Europe (95.3%, a difference of 0.010%), Samoan (95.4%, a difference of 0.020%), and Immigrants from Eastern Asia (95.4%, a difference of 0.020%).
| Demographics | Rating | Rank | 8th Grade |
| Immigrants | Liberia | 8.9 /100 | #215 | Tragic 95.4% |
| Samoans | 8.4 /100 | #216 | Tragic 95.4% |
| Immigrants | Eastern Asia | 8.3 /100 | #217 | Tragic 95.4% |
| Dutch West Indians | 8.1 /100 | #218 | Tragic 95.4% |
| Spanish Americans | 8.0 /100 | #219 | Tragic 95.4% |
| Immigrants | Southern Europe | 7.7 /100 | #220 | Tragic 95.3% |
| Immigrants | Syria | 7.4 /100 | #221 | Tragic 95.3% |
| Immigrants | Malaysia | 7.3 /100 | #222 | Tragic 95.3% |
| Immigrants | Oceania | 7.1 /100 | #223 | Tragic 95.3% |
| Immigrants | Western Asia | 6.0 /100 | #224 | Tragic 95.3% |
| Sub-Saharan Africans | 6.0 /100 | #225 | Tragic 95.3% |
| Navajo | 5.7 /100 | #226 | Tragic 95.3% |
| Bahamians | 5.6 /100 | #227 | Tragic 95.3% |
| Immigrants | Eastern Africa | 5.6 /100 | #228 | Tragic 95.3% |
| Immigrants | Indonesia | 4.4 /100 | #229 | Tragic 95.3% |