Australian vs U.S. Virgin Islander Nursery School
COMPARE
Australian
U.S. Virgin Islander
Nursery School
Nursery School Comparison
Australians
U.S. Virgin Islanders
98.5%
NURSERY SCHOOL
99.8/ 100
METRIC RATING
52nd/ 347
METRIC RANK
97.7%
NURSERY SCHOOL
2.1/ 100
METRIC RATING
233rd/ 347
METRIC RANK
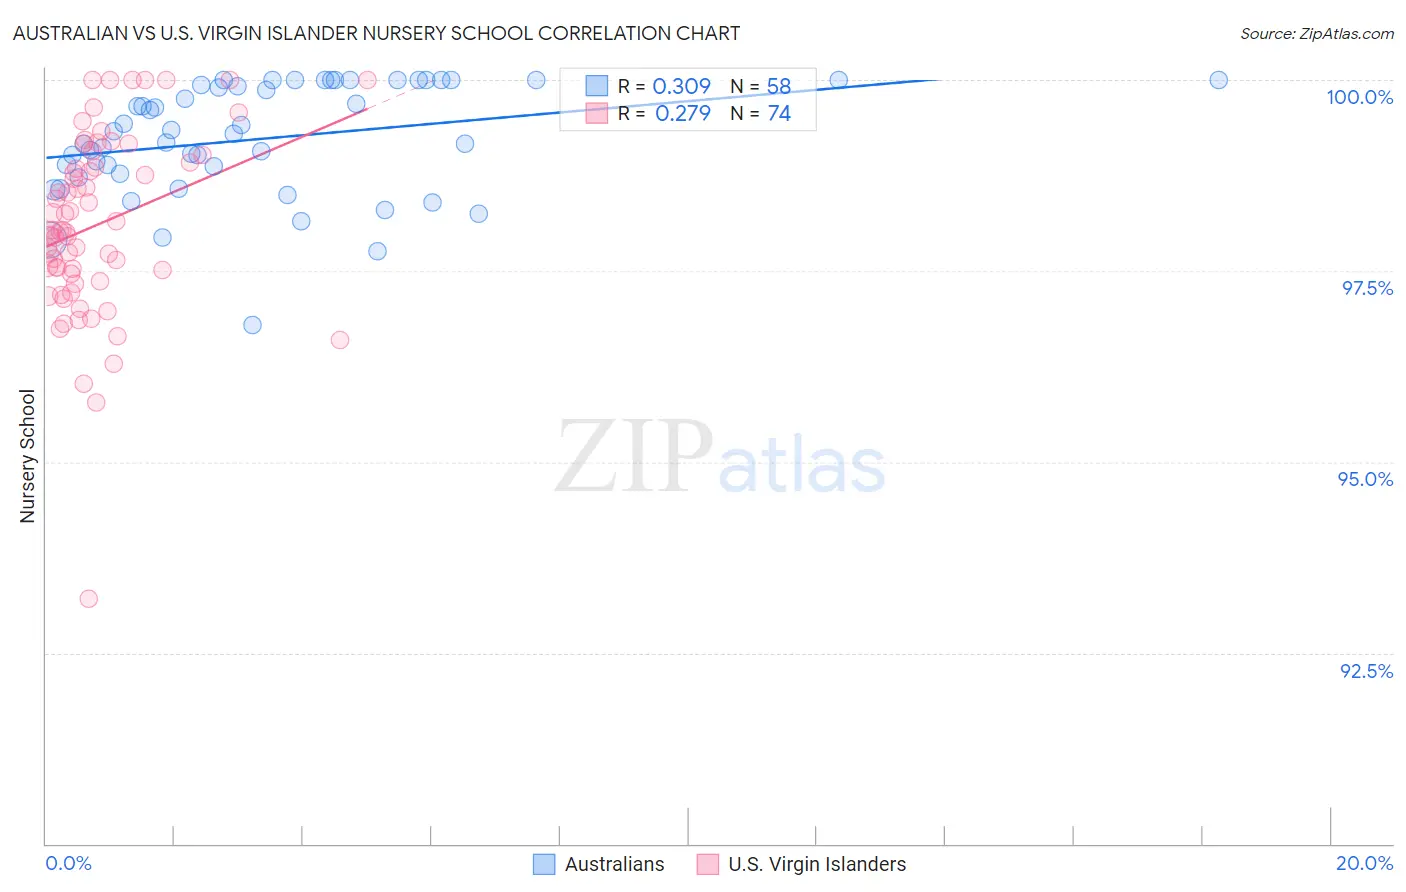
Australian vs U.S. Virgin Islander Nursery School Correlation Chart
The statistical analysis conducted on geographies consisting of 224,153,392 people shows a mild positive correlation between the proportion of Australians and percentage of population with at least nursery school education in the United States with a correlation coefficient (R) of 0.309 and weighted average of 98.5%. Similarly, the statistical analysis conducted on geographies consisting of 87,529,315 people shows a weak positive correlation between the proportion of U.S. Virgin Islanders and percentage of population with at least nursery school education in the United States with a correlation coefficient (R) of 0.279 and weighted average of 97.7%, a difference of 0.77%.
Nursery School Correlation Summary
| Measurement | Australian | U.S. Virgin Islander |
| Minimum | 96.8% | 93.2% |
| Maximum | 100.0% | 100.0% |
| Range | 3.2% | 6.8% |
| Mean | 99.2% | 98.1% |
| Median | 99.3% | 98.0% |
| Interquartile 25% (IQ1) | 98.8% | 97.5% |
| Interquartile 75% (IQ3) | 100.0% | 98.9% |
| Interquartile Range (IQR) | 1.2% | 1.4% |
| Standard Deviation (Sample) | 0.74% | 1.2% |
| Standard Deviation (Population) | 0.73% | 1.2% |
Similar Demographics by Nursery School
Demographics Similar to Australians by Nursery School
In terms of nursery school, the demographic groups most similar to Australians are White/Caucasian (98.5%, a difference of 0.0%), Celtic (98.5%, a difference of 0.0%), Estonian (98.5%, a difference of 0.0%), Czechoslovakian (98.5%, a difference of 0.010%), and Ottawa (98.5%, a difference of 0.010%).
| Demographics | Rating | Rank | Nursery School |
| Northern Europeans | 99.9 /100 | #45 | Exceptional 98.5% |
| Hungarians | 99.9 /100 | #46 | Exceptional 98.5% |
| Czechoslovakians | 99.9 /100 | #47 | Exceptional 98.5% |
| Ottawa | 99.8 /100 | #48 | Exceptional 98.5% |
| Whites/Caucasians | 99.8 /100 | #49 | Exceptional 98.5% |
| Celtics | 99.8 /100 | #50 | Exceptional 98.5% |
| Estonians | 99.8 /100 | #51 | Exceptional 98.5% |
| Australians | 99.8 /100 | #52 | Exceptional 98.5% |
| Kiowa | 99.8 /100 | #53 | Exceptional 98.4% |
| Pueblo | 99.8 /100 | #54 | Exceptional 98.4% |
| Immigrants | Scotland | 99.8 /100 | #55 | Exceptional 98.4% |
| Americans | 99.8 /100 | #56 | Exceptional 98.4% |
| Austrians | 99.8 /100 | #57 | Exceptional 98.4% |
| Bulgarians | 99.8 /100 | #58 | Exceptional 98.4% |
| Immigrants | Canada | 99.8 /100 | #59 | Exceptional 98.4% |
Demographics Similar to U.S. Virgin Islanders by Nursery School
In terms of nursery school, the demographic groups most similar to U.S. Virgin Islanders are Colombian (97.7%, a difference of 0.0%), Immigrants from Pakistan (97.7%, a difference of 0.0%), Puerto Rican (97.7%, a difference of 0.010%), Immigrants from Uruguay (97.7%, a difference of 0.010%), and Immigrants from Malaysia (97.7%, a difference of 0.010%).
| Demographics | Rating | Rank | Nursery School |
| Iraqis | 3.5 /100 | #226 | Tragic 97.7% |
| Sub-Saharan Africans | 3.2 /100 | #227 | Tragic 97.7% |
| Sudanese | 3.2 /100 | #228 | Tragic 97.7% |
| Senegalese | 3.2 /100 | #229 | Tragic 97.7% |
| Sierra Leoneans | 2.9 /100 | #230 | Tragic 97.7% |
| Puerto Ricans | 2.6 /100 | #231 | Tragic 97.7% |
| Immigrants | Uruguay | 2.3 /100 | #232 | Tragic 97.7% |
| U.S. Virgin Islanders | 2.1 /100 | #233 | Tragic 97.7% |
| Colombians | 2.1 /100 | #234 | Tragic 97.7% |
| Immigrants | Pakistan | 2.1 /100 | #235 | Tragic 97.7% |
| Immigrants | Malaysia | 1.9 /100 | #236 | Tragic 97.7% |
| Immigrants | Western Asia | 1.9 /100 | #237 | Tragic 97.7% |
| Nigerians | 1.7 /100 | #238 | Tragic 97.7% |
| Immigrants | Eastern Asia | 1.6 /100 | #239 | Tragic 97.7% |
| Koreans | 1.4 /100 | #240 | Tragic 97.7% |