Scottish vs Nepalese Hearing Disability
COMPARE
Scottish
Nepalese
Hearing Disability
Hearing Disability Comparison
Scottish
Nepalese
3.7%
HEARING DISABILITY
0.0/ 100
METRIC RATING
300th/ 347
METRIC RANK
3.3%
HEARING DISABILITY
1.2/ 100
METRIC RATING
239th/ 347
METRIC RANK
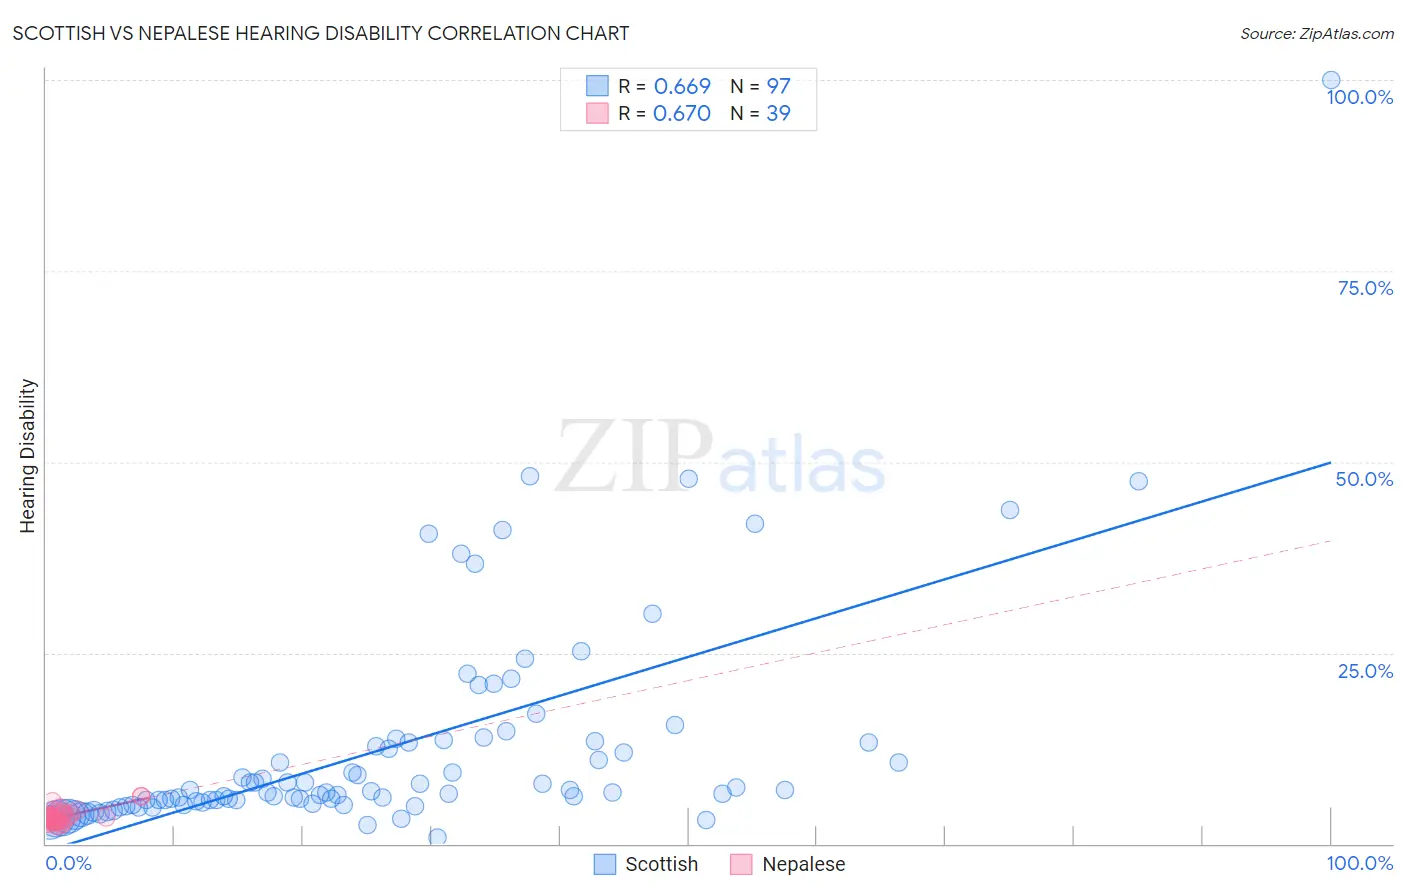
Scottish vs Nepalese Hearing Disability Correlation Chart
The statistical analysis conducted on geographies consisting of 566,483,062 people shows a significant positive correlation between the proportion of Scottish and percentage of population with hearing disability in the United States with a correlation coefficient (R) of 0.669 and weighted average of 3.7%. Similarly, the statistical analysis conducted on geographies consisting of 24,517,800 people shows a significant positive correlation between the proportion of Nepalese and percentage of population with hearing disability in the United States with a correlation coefficient (R) of 0.670 and weighted average of 3.3%, a difference of 13.0%.
Hearing Disability Correlation Summary
| Measurement | Scottish | Nepalese |
| Minimum | 0.87% | 2.4% |
| Maximum | 100.0% | 6.3% |
| Range | 99.1% | 3.9% |
| Mean | 12.6% | 3.5% |
| Median | 6.8% | 3.3% |
| Interquartile 25% (IQ1) | 5.4% | 3.0% |
| Interquartile 75% (IQ3) | 13.4% | 3.9% |
| Interquartile Range (IQR) | 8.0% | 0.90% |
| Standard Deviation (Sample) | 14.5% | 0.92% |
| Standard Deviation (Population) | 14.4% | 0.91% |
Similar Demographics by Hearing Disability
Demographics Similar to Scottish by Hearing Disability
In terms of hearing disability, the demographic groups most similar to Scottish are Pennsylvania German (3.7%, a difference of 0.030%), German (3.7%, a difference of 0.060%), Dutch (3.7%, a difference of 0.13%), Menominee (3.7%, a difference of 0.19%), and Celtic (3.7%, a difference of 0.34%).
| Demographics | Rating | Rank | Hearing Disability |
| Norwegians | 0.0 /100 | #293 | Tragic 3.7% |
| Iroquois | 0.0 /100 | #294 | Tragic 3.7% |
| Welsh | 0.0 /100 | #295 | Tragic 3.7% |
| Pima | 0.0 /100 | #296 | Tragic 3.7% |
| Immigrants | Azores | 0.0 /100 | #297 | Tragic 3.7% |
| Celtics | 0.0 /100 | #298 | Tragic 3.7% |
| Germans | 0.0 /100 | #299 | Tragic 3.7% |
| Scottish | 0.0 /100 | #300 | Tragic 3.7% |
| Pennsylvania Germans | 0.0 /100 | #301 | Tragic 3.7% |
| Dutch | 0.0 /100 | #302 | Tragic 3.7% |
| Menominee | 0.0 /100 | #303 | Tragic 3.7% |
| French | 0.0 /100 | #304 | Tragic 3.8% |
| English | 0.0 /100 | #305 | Tragic 3.8% |
| Marshallese | 0.0 /100 | #306 | Tragic 3.8% |
| French Canadians | 0.0 /100 | #307 | Tragic 3.8% |
Demographics Similar to Nepalese by Hearing Disability
In terms of hearing disability, the demographic groups most similar to Nepalese are Immigrants from Netherlands (3.3%, a difference of 0.18%), Samoan (3.3%, a difference of 0.25%), Yugoslavian (3.3%, a difference of 0.36%), Immigrants from Western Europe (3.3%, a difference of 0.53%), and Assyrian/Chaldean/Syriac (3.3%, a difference of 0.60%).
| Demographics | Rating | Rank | Hearing Disability |
| Ukrainians | 2.9 /100 | #232 | Tragic 3.2% |
| Estonians | 2.4 /100 | #233 | Tragic 3.3% |
| Central American Indians | 2.3 /100 | #234 | Tragic 3.3% |
| Guamanians/Chamorros | 2.2 /100 | #235 | Tragic 3.3% |
| Serbians | 2.2 /100 | #236 | Tragic 3.3% |
| Immigrants | Austria | 1.8 /100 | #237 | Tragic 3.3% |
| German Russians | 1.8 /100 | #238 | Tragic 3.3% |
| Nepalese | 1.2 /100 | #239 | Tragic 3.3% |
| Immigrants | Netherlands | 1.1 /100 | #240 | Tragic 3.3% |
| Samoans | 1.1 /100 | #241 | Tragic 3.3% |
| Yugoslavians | 1.0 /100 | #242 | Tragic 3.3% |
| Immigrants | Western Europe | 1.0 /100 | #243 | Tragic 3.3% |
| Assyrians/Chaldeans/Syriacs | 0.9 /100 | #244 | Tragic 3.3% |
| Immigrants | Scotland | 0.8 /100 | #245 | Tragic 3.3% |
| Immigrants | England | 0.7 /100 | #246 | Tragic 3.3% |