Indonesian vs Immigrants from Somalia Hearing Disability
COMPARE
Indonesian
Immigrants from Somalia
Hearing Disability
Hearing Disability Comparison
Indonesians
Immigrants from Somalia
3.0%
HEARING DISABILITY
50.0/ 100
METRIC RATING
174th/ 347
METRIC RANK
2.8%
HEARING DISABILITY
95.5/ 100
METRIC RATING
96th/ 347
METRIC RANK
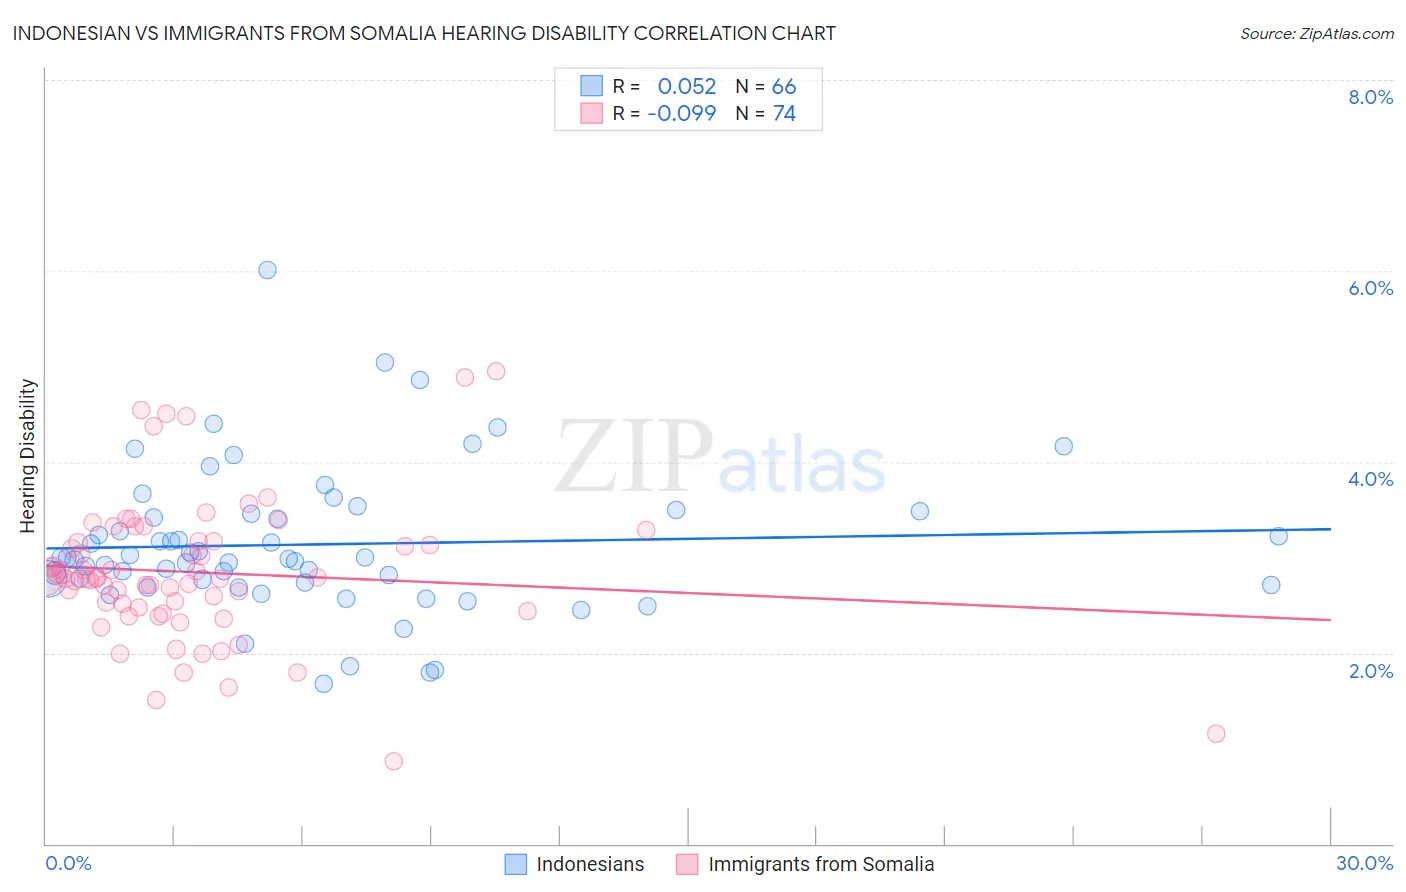
Indonesian vs Immigrants from Somalia Hearing Disability Correlation Chart
The statistical analysis conducted on geographies consisting of 162,712,872 people shows a slight positive correlation between the proportion of Indonesians and percentage of population with hearing disability in the United States with a correlation coefficient (R) of 0.052 and weighted average of 3.0%. Similarly, the statistical analysis conducted on geographies consisting of 92,097,804 people shows a slight negative correlation between the proportion of Immigrants from Somalia and percentage of population with hearing disability in the United States with a correlation coefficient (R) of -0.099 and weighted average of 2.8%, a difference of 7.7%.
Hearing Disability Correlation Summary
| Measurement | Indonesian | Immigrants from Somalia |
| Minimum | 1.7% | 0.87% |
| Maximum | 6.0% | 5.0% |
| Range | 4.3% | 4.1% |
| Mean | 3.1% | 2.8% |
| Median | 3.0% | 2.8% |
| Interquartile 25% (IQ1) | 2.7% | 2.5% |
| Interquartile 75% (IQ3) | 3.5% | 3.2% |
| Interquartile Range (IQR) | 0.72% | 0.69% |
| Standard Deviation (Sample) | 0.76% | 0.75% |
| Standard Deviation (Population) | 0.76% | 0.75% |
Similar Demographics by Hearing Disability
Demographics Similar to Indonesians by Hearing Disability
In terms of hearing disability, the demographic groups most similar to Indonesians are Immigrants from Serbia (3.0%, a difference of 0.10%), Immigrants from Romania (3.0%, a difference of 0.15%), Panamanian (3.0%, a difference of 0.28%), Immigrants from Philippines (3.0%, a difference of 0.34%), and Japanese (3.0%, a difference of 0.38%).
| Demographics | Rating | Rank | Hearing Disability |
| Immigrants | Eastern Europe | 58.1 /100 | #167 | Average 3.0% |
| Immigrants | Greece | 57.9 /100 | #168 | Average 3.0% |
| Arabs | 57.6 /100 | #169 | Average 3.0% |
| Immigrants | Cabo Verde | 56.9 /100 | #170 | Average 3.0% |
| Immigrants | Ukraine | 56.6 /100 | #171 | Average 3.0% |
| Armenians | 56.0 /100 | #172 | Average 3.0% |
| Immigrants | Serbia | 51.1 /100 | #173 | Average 3.0% |
| Indonesians | 50.0 /100 | #174 | Average 3.0% |
| Immigrants | Romania | 48.4 /100 | #175 | Average 3.0% |
| Panamanians | 47.0 /100 | #176 | Average 3.0% |
| Immigrants | Philippines | 46.4 /100 | #177 | Average 3.0% |
| Japanese | 46.0 /100 | #178 | Average 3.0% |
| Immigrants | Moldova | 43.1 /100 | #179 | Average 3.0% |
| Immigrants | Sweden | 42.4 /100 | #180 | Average 3.0% |
| Immigrants | Belgium | 41.5 /100 | #181 | Average 3.0% |
Demographics Similar to Immigrants from Somalia by Hearing Disability
In terms of hearing disability, the demographic groups most similar to Immigrants from Somalia are Immigrants from Afghanistan (2.8%, a difference of 0.17%), Israeli (2.8%, a difference of 0.19%), Uruguayan (2.8%, a difference of 0.21%), Immigrants from Honduras (2.8%, a difference of 0.23%), and Immigrants from Guatemala (2.8%, a difference of 0.27%).
| Demographics | Rating | Rank | Hearing Disability |
| Belizeans | 96.6 /100 | #89 | Exceptional 2.8% |
| Immigrants | Morocco | 96.6 /100 | #90 | Exceptional 2.8% |
| Immigrants | Middle Africa | 96.5 /100 | #91 | Exceptional 2.8% |
| Iranians | 96.4 /100 | #92 | Exceptional 2.8% |
| Immigrants | Kuwait | 96.3 /100 | #93 | Exceptional 2.8% |
| Uruguayans | 95.9 /100 | #94 | Exceptional 2.8% |
| Israelis | 95.9 /100 | #95 | Exceptional 2.8% |
| Immigrants | Somalia | 95.5 /100 | #96 | Exceptional 2.8% |
| Immigrants | Afghanistan | 95.3 /100 | #97 | Exceptional 2.8% |
| Immigrants | Honduras | 95.1 /100 | #98 | Exceptional 2.8% |
| Immigrants | Guatemala | 95.1 /100 | #99 | Exceptional 2.8% |
| Immigrants | Eastern Africa | 95.0 /100 | #100 | Exceptional 2.8% |
| Immigrants | Spain | 94.9 /100 | #101 | Exceptional 2.8% |
| Taiwanese | 94.8 /100 | #102 | Exceptional 2.8% |
| Immigrants | Indonesia | 94.7 /100 | #103 | Exceptional 2.8% |