Australian vs Turkish Cognitive Disability
COMPARE
Australian
Turkish
Cognitive Disability
Cognitive Disability Comparison
Australians
Turks
17.2%
COGNITIVE DISABILITY
72.4/ 100
METRIC RATING
160th/ 347
METRIC RANK
16.9%
COGNITIVE DISABILITY
94.5/ 100
METRIC RATING
124th/ 347
METRIC RANK
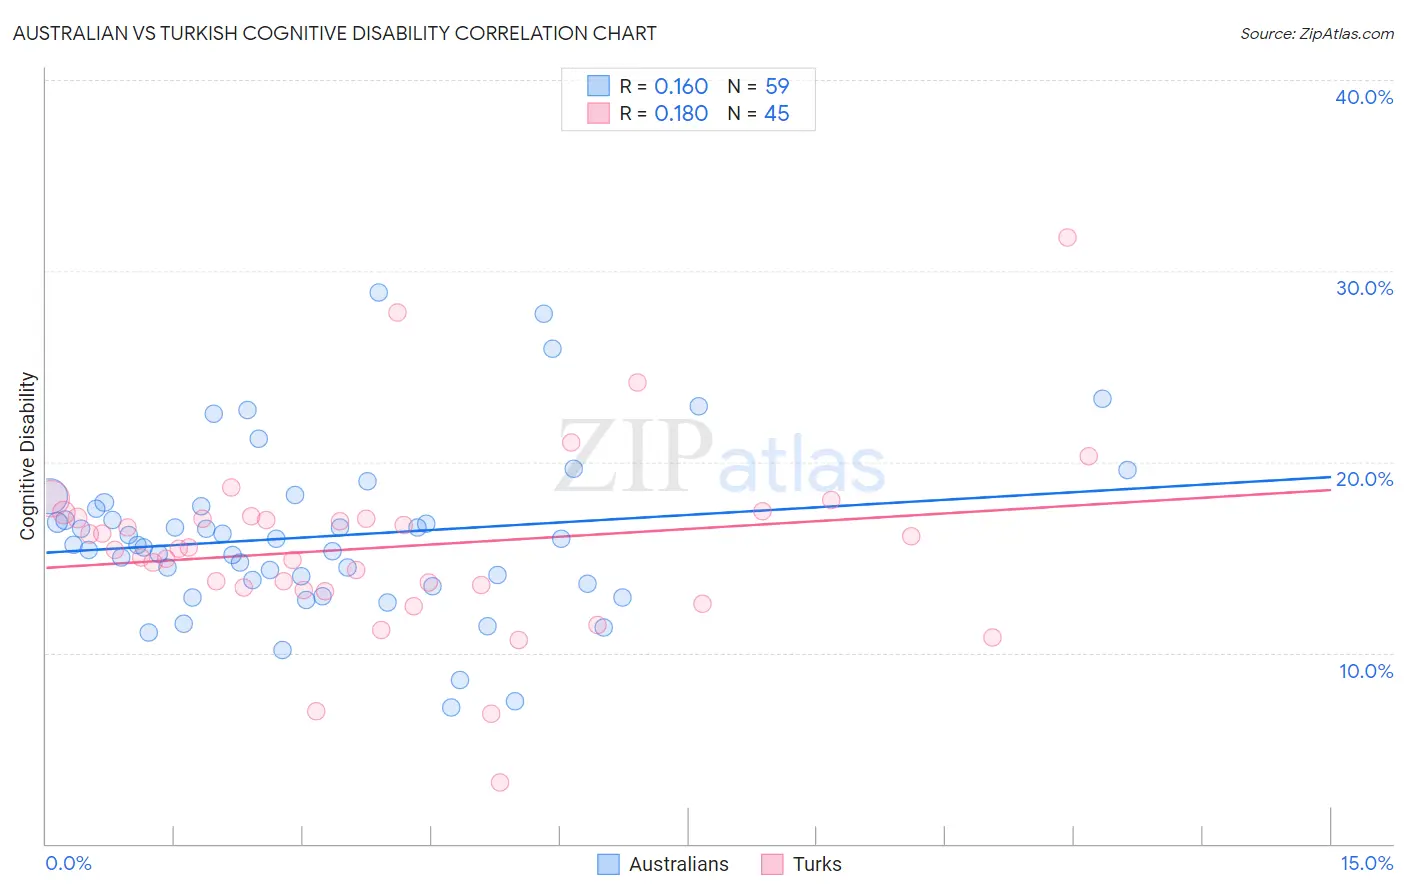
Australian vs Turkish Cognitive Disability Correlation Chart
The statistical analysis conducted on geographies consisting of 224,142,484 people shows a poor positive correlation between the proportion of Australians and percentage of population with cognitive disability in the United States with a correlation coefficient (R) of 0.160 and weighted average of 17.2%. Similarly, the statistical analysis conducted on geographies consisting of 271,856,342 people shows a poor positive correlation between the proportion of Turks and percentage of population with cognitive disability in the United States with a correlation coefficient (R) of 0.180 and weighted average of 16.9%, a difference of 1.4%.
Cognitive Disability Correlation Summary
| Measurement | Australian | Turkish |
| Minimum | 7.1% | 3.2% |
| Maximum | 28.9% | 31.8% |
| Range | 21.7% | 28.5% |
| Mean | 16.1% | 15.5% |
| Median | 15.7% | 15.5% |
| Interquartile 25% (IQ1) | 13.6% | 13.4% |
| Interquartile 75% (IQ3) | 17.7% | 17.1% |
| Interquartile Range (IQR) | 4.1% | 3.8% |
| Standard Deviation (Sample) | 4.3% | 4.8% |
| Standard Deviation (Population) | 4.3% | 4.8% |
Similar Demographics by Cognitive Disability
Demographics Similar to Australians by Cognitive Disability
In terms of cognitive disability, the demographic groups most similar to Australians are American (17.2%, a difference of 0.010%), Immigrants from Latvia (17.2%, a difference of 0.030%), Yugoslavian (17.2%, a difference of 0.030%), Immigrants from Switzerland (17.2%, a difference of 0.030%), and Celtic (17.1%, a difference of 0.060%).
| Demographics | Rating | Rank | Cognitive Disability |
| Immigrants | Kazakhstan | 80.5 /100 | #153 | Excellent 17.1% |
| Immigrants | Malaysia | 79.3 /100 | #154 | Good 17.1% |
| Brazilians | 78.9 /100 | #155 | Good 17.1% |
| Sri Lankans | 78.9 /100 | #156 | Good 17.1% |
| Immigrants | Australia | 76.0 /100 | #157 | Good 17.1% |
| Celtics | 74.1 /100 | #158 | Good 17.1% |
| Immigrants | Latvia | 73.2 /100 | #159 | Good 17.2% |
| Australians | 72.4 /100 | #160 | Good 17.2% |
| Americans | 72.2 /100 | #161 | Good 17.2% |
| Yugoslavians | 71.6 /100 | #162 | Good 17.2% |
| Immigrants | Switzerland | 71.5 /100 | #163 | Good 17.2% |
| Armenians | 70.1 /100 | #164 | Good 17.2% |
| Immigrants | Albania | 64.9 /100 | #165 | Good 17.2% |
| Immigrants | Ecuador | 64.4 /100 | #166 | Good 17.2% |
| Immigrants | Syria | 63.5 /100 | #167 | Good 17.2% |
Demographics Similar to Turks by Cognitive Disability
In terms of cognitive disability, the demographic groups most similar to Turks are Portuguese (16.9%, a difference of 0.020%), Immigrants from Western Europe (16.9%, a difference of 0.030%), Immigrants from China (16.9%, a difference of 0.050%), Scandinavian (16.9%, a difference of 0.050%), and Scottish (16.9%, a difference of 0.070%).
| Demographics | Rating | Rank | Cognitive Disability |
| Immigrants | Japan | 96.2 /100 | #117 | Exceptional 16.9% |
| Immigrants | Denmark | 96.2 /100 | #118 | Exceptional 16.9% |
| South Africans | 95.5 /100 | #119 | Exceptional 16.9% |
| Scottish | 95.0 /100 | #120 | Exceptional 16.9% |
| Immigrants | China | 94.9 /100 | #121 | Exceptional 16.9% |
| Immigrants | Western Europe | 94.8 /100 | #122 | Exceptional 16.9% |
| Portuguese | 94.7 /100 | #123 | Exceptional 16.9% |
| Turks | 94.5 /100 | #124 | Exceptional 16.9% |
| Scandinavians | 94.1 /100 | #125 | Exceptional 16.9% |
| Europeans | 93.4 /100 | #126 | Exceptional 17.0% |
| Immigrants | Costa Rica | 93.1 /100 | #127 | Exceptional 17.0% |
| Nicaraguans | 93.0 /100 | #128 | Exceptional 17.0% |
| Immigrants | Uruguay | 92.9 /100 | #129 | Exceptional 17.0% |
| Immigrants | Vietnam | 92.4 /100 | #130 | Exceptional 17.0% |
| Immigrants | Germany | 92.1 /100 | #131 | Exceptional 17.0% |