Australian vs Paiute Cognitive Disability
COMPARE
Australian
Paiute
Cognitive Disability
Cognitive Disability Comparison
Australians
Paiute
17.2%
COGNITIVE DISABILITY
72.4/ 100
METRIC RATING
160th/ 347
METRIC RANK
17.8%
COGNITIVE DISABILITY
1.1/ 100
METRIC RATING
242nd/ 347
METRIC RANK
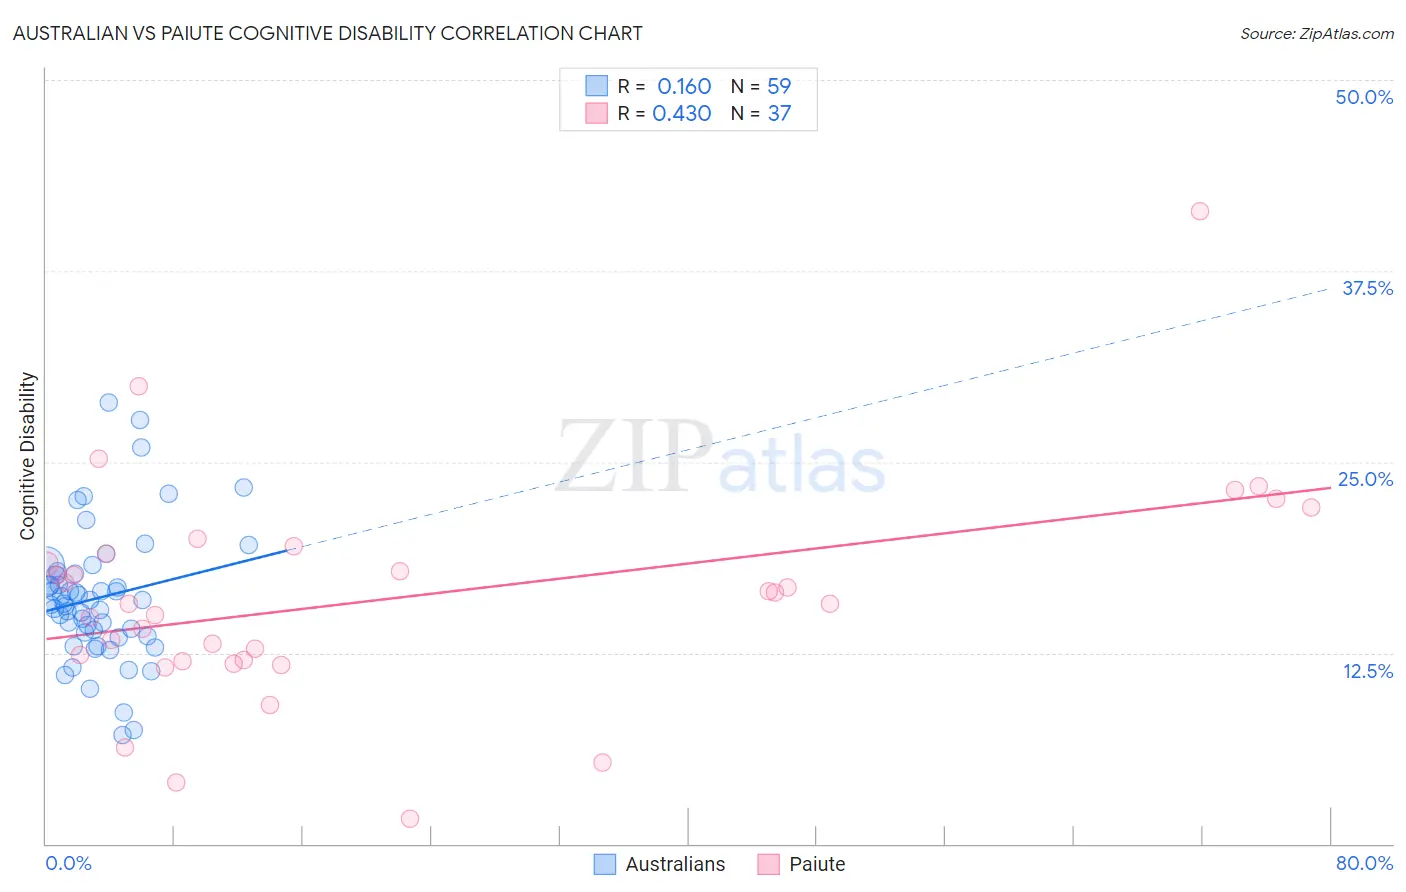
Australian vs Paiute Cognitive Disability Correlation Chart
The statistical analysis conducted on geographies consisting of 224,142,484 people shows a poor positive correlation between the proportion of Australians and percentage of population with cognitive disability in the United States with a correlation coefficient (R) of 0.160 and weighted average of 17.2%. Similarly, the statistical analysis conducted on geographies consisting of 58,394,773 people shows a moderate positive correlation between the proportion of Paiute and percentage of population with cognitive disability in the United States with a correlation coefficient (R) of 0.430 and weighted average of 17.8%, a difference of 3.9%.
Cognitive Disability Correlation Summary
| Measurement | Australian | Paiute |
| Minimum | 7.1% | 1.6% |
| Maximum | 28.9% | 41.4% |
| Range | 21.7% | 39.8% |
| Mean | 16.1% | 16.1% |
| Median | 15.7% | 15.8% |
| Interquartile 25% (IQ1) | 13.6% | 12.0% |
| Interquartile 75% (IQ3) | 17.7% | 19.2% |
| Interquartile Range (IQR) | 4.1% | 7.2% |
| Standard Deviation (Sample) | 4.3% | 7.3% |
| Standard Deviation (Population) | 4.3% | 7.2% |
Similar Demographics by Cognitive Disability
Demographics Similar to Australians by Cognitive Disability
In terms of cognitive disability, the demographic groups most similar to Australians are American (17.2%, a difference of 0.010%), Immigrants from Latvia (17.2%, a difference of 0.030%), Yugoslavian (17.2%, a difference of 0.030%), Immigrants from Switzerland (17.2%, a difference of 0.030%), and Celtic (17.1%, a difference of 0.060%).
| Demographics | Rating | Rank | Cognitive Disability |
| Immigrants | Kazakhstan | 80.5 /100 | #153 | Excellent 17.1% |
| Immigrants | Malaysia | 79.3 /100 | #154 | Good 17.1% |
| Brazilians | 78.9 /100 | #155 | Good 17.1% |
| Sri Lankans | 78.9 /100 | #156 | Good 17.1% |
| Immigrants | Australia | 76.0 /100 | #157 | Good 17.1% |
| Celtics | 74.1 /100 | #158 | Good 17.1% |
| Immigrants | Latvia | 73.2 /100 | #159 | Good 17.2% |
| Australians | 72.4 /100 | #160 | Good 17.2% |
| Americans | 72.2 /100 | #161 | Good 17.2% |
| Yugoslavians | 71.6 /100 | #162 | Good 17.2% |
| Immigrants | Switzerland | 71.5 /100 | #163 | Good 17.2% |
| Armenians | 70.1 /100 | #164 | Good 17.2% |
| Immigrants | Albania | 64.9 /100 | #165 | Good 17.2% |
| Immigrants | Ecuador | 64.4 /100 | #166 | Good 17.2% |
| Immigrants | Syria | 63.5 /100 | #167 | Good 17.2% |
Demographics Similar to Paiute by Cognitive Disability
In terms of cognitive disability, the demographic groups most similar to Paiute are Mexican (17.8%, a difference of 0.020%), Immigrants from Bangladesh (17.8%, a difference of 0.070%), Jamaican (17.9%, a difference of 0.11%), Iraqi (17.8%, a difference of 0.16%), and Cajun (17.8%, a difference of 0.19%).
| Demographics | Rating | Rank | Cognitive Disability |
| Spanish American Indians | 2.0 /100 | #235 | Tragic 17.8% |
| Immigrants | Iraq | 1.8 /100 | #236 | Tragic 17.8% |
| Immigrants | Mexico | 1.8 /100 | #237 | Tragic 17.8% |
| Cheyenne | 1.7 /100 | #238 | Tragic 17.8% |
| Cajuns | 1.4 /100 | #239 | Tragic 17.8% |
| Iraqis | 1.4 /100 | #240 | Tragic 17.8% |
| Mexicans | 1.1 /100 | #241 | Tragic 17.8% |
| Paiute | 1.1 /100 | #242 | Tragic 17.8% |
| Immigrants | Bangladesh | 1.0 /100 | #243 | Tragic 17.8% |
| Jamaicans | 0.9 /100 | #244 | Tragic 17.9% |
| Trinidadians and Tobagonians | 0.8 /100 | #245 | Tragic 17.9% |
| Immigrants | Thailand | 0.8 /100 | #246 | Tragic 17.9% |
| Samoans | 0.7 /100 | #247 | Tragic 17.9% |
| French American Indians | 0.7 /100 | #248 | Tragic 17.9% |
| Cree | 0.7 /100 | #249 | Tragic 17.9% |