Australian vs Immigrants from Cambodia Cognitive Disability
COMPARE
Australian
Immigrants from Cambodia
Cognitive Disability
Cognitive Disability Comparison
Australians
Immigrants from Cambodia
17.2%
COGNITIVE DISABILITY
72.4/ 100
METRIC RATING
160th/ 347
METRIC RANK
18.1%
COGNITIVE DISABILITY
0.1/ 100
METRIC RATING
282nd/ 347
METRIC RANK
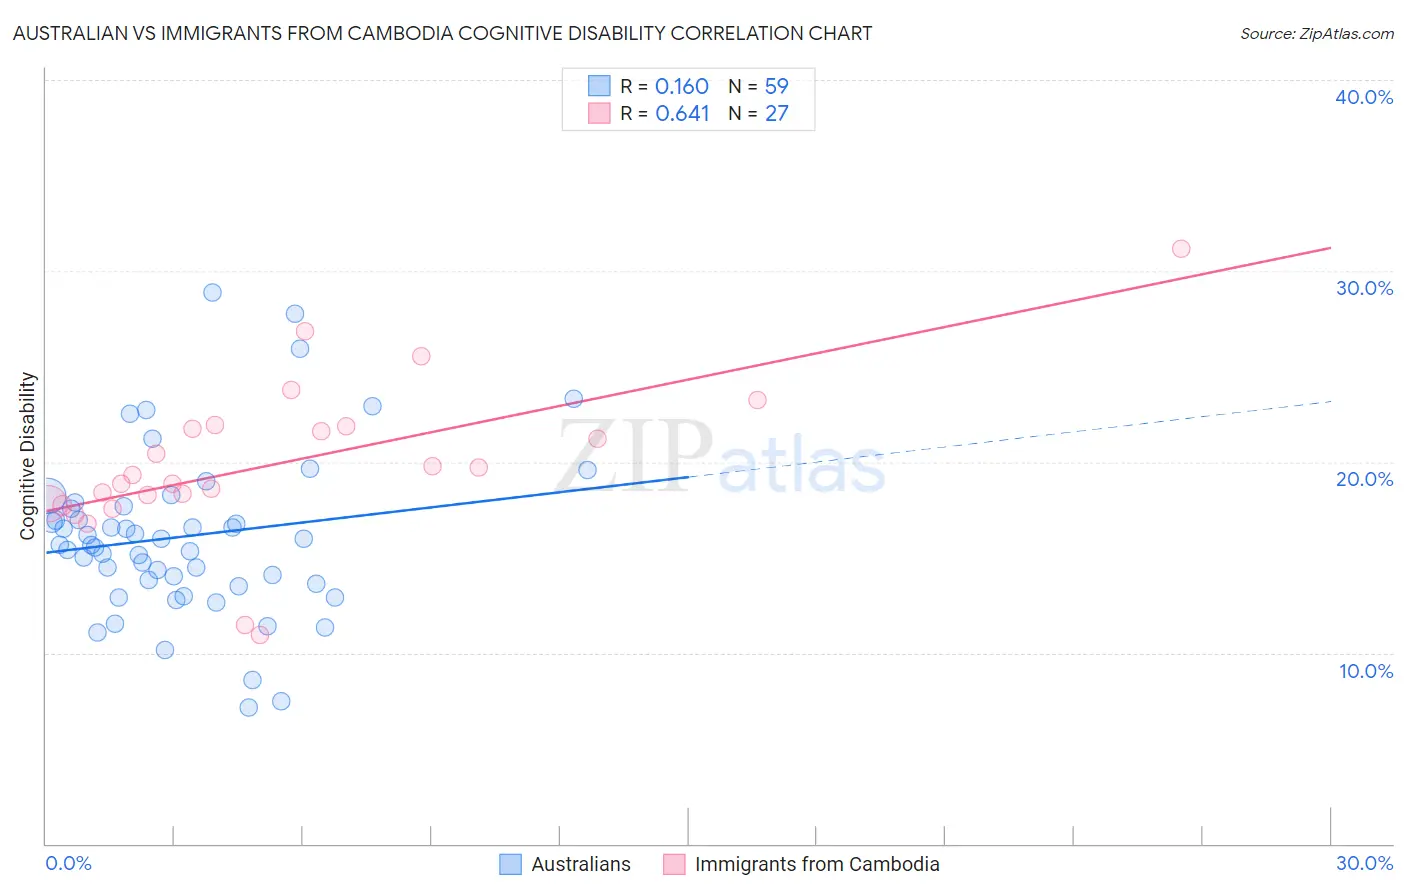
Australian vs Immigrants from Cambodia Cognitive Disability Correlation Chart
The statistical analysis conducted on geographies consisting of 224,142,484 people shows a poor positive correlation between the proportion of Australians and percentage of population with cognitive disability in the United States with a correlation coefficient (R) of 0.160 and weighted average of 17.2%. Similarly, the statistical analysis conducted on geographies consisting of 205,155,269 people shows a significant positive correlation between the proportion of Immigrants from Cambodia and percentage of population with cognitive disability in the United States with a correlation coefficient (R) of 0.641 and weighted average of 18.1%, a difference of 5.5%.
Cognitive Disability Correlation Summary
| Measurement | Australian | Immigrants from Cambodia |
| Minimum | 7.1% | 10.9% |
| Maximum | 28.9% | 31.2% |
| Range | 21.7% | 20.2% |
| Mean | 16.1% | 20.0% |
| Median | 15.7% | 19.3% |
| Interquartile 25% (IQ1) | 13.6% | 17.8% |
| Interquartile 75% (IQ3) | 17.7% | 21.9% |
| Interquartile Range (IQR) | 4.1% | 4.1% |
| Standard Deviation (Sample) | 4.3% | 4.1% |
| Standard Deviation (Population) | 4.3% | 4.1% |
Similar Demographics by Cognitive Disability
Demographics Similar to Australians by Cognitive Disability
In terms of cognitive disability, the demographic groups most similar to Australians are American (17.2%, a difference of 0.010%), Immigrants from Latvia (17.2%, a difference of 0.030%), Yugoslavian (17.2%, a difference of 0.030%), Immigrants from Switzerland (17.2%, a difference of 0.030%), and Celtic (17.1%, a difference of 0.060%).
| Demographics | Rating | Rank | Cognitive Disability |
| Immigrants | Kazakhstan | 80.5 /100 | #153 | Excellent 17.1% |
| Immigrants | Malaysia | 79.3 /100 | #154 | Good 17.1% |
| Brazilians | 78.9 /100 | #155 | Good 17.1% |
| Sri Lankans | 78.9 /100 | #156 | Good 17.1% |
| Immigrants | Australia | 76.0 /100 | #157 | Good 17.1% |
| Celtics | 74.1 /100 | #158 | Good 17.1% |
| Immigrants | Latvia | 73.2 /100 | #159 | Good 17.2% |
| Australians | 72.4 /100 | #160 | Good 17.2% |
| Americans | 72.2 /100 | #161 | Good 17.2% |
| Yugoslavians | 71.6 /100 | #162 | Good 17.2% |
| Immigrants | Switzerland | 71.5 /100 | #163 | Good 17.2% |
| Armenians | 70.1 /100 | #164 | Good 17.2% |
| Immigrants | Albania | 64.9 /100 | #165 | Good 17.2% |
| Immigrants | Ecuador | 64.4 /100 | #166 | Good 17.2% |
| Immigrants | Syria | 63.5 /100 | #167 | Good 17.2% |
Demographics Similar to Immigrants from Cambodia by Cognitive Disability
In terms of cognitive disability, the demographic groups most similar to Immigrants from Cambodia are Yakama (18.1%, a difference of 0.020%), Nigerian (18.1%, a difference of 0.020%), Immigrants from Uganda (18.1%, a difference of 0.060%), Bermudan (18.1%, a difference of 0.080%), and Kenyan (18.1%, a difference of 0.11%).
| Demographics | Rating | Rank | Cognitive Disability |
| Immigrants | Laos | 0.2 /100 | #275 | Tragic 18.1% |
| Yuman | 0.2 /100 | #276 | Tragic 18.1% |
| Immigrants | Kuwait | 0.2 /100 | #277 | Tragic 18.1% |
| Immigrants | Micronesia | 0.2 /100 | #278 | Tragic 18.1% |
| Chippewa | 0.1 /100 | #279 | Tragic 18.1% |
| West Indians | 0.1 /100 | #280 | Tragic 18.1% |
| Yakama | 0.1 /100 | #281 | Tragic 18.1% |
| Immigrants | Cambodia | 0.1 /100 | #282 | Tragic 18.1% |
| Nigerians | 0.1 /100 | #283 | Tragic 18.1% |
| Immigrants | Uganda | 0.1 /100 | #284 | Tragic 18.1% |
| Bermudans | 0.1 /100 | #285 | Tragic 18.1% |
| Kenyans | 0.1 /100 | #286 | Tragic 18.1% |
| Dutch West Indians | 0.1 /100 | #287 | Tragic 18.1% |
| Immigrants | West Indies | 0.1 /100 | #288 | Tragic 18.1% |
| Natives/Alaskans | 0.1 /100 | #289 | Tragic 18.1% |