Paraguayan vs Immigrants from Cambodia Cognitive Disability
COMPARE
Paraguayan
Immigrants from Cambodia
Cognitive Disability
Cognitive Disability Comparison
Paraguayans
Immigrants from Cambodia
16.8%
COGNITIVE DISABILITY
98.0/ 100
METRIC RATING
103rd/ 347
METRIC RANK
18.1%
COGNITIVE DISABILITY
0.1/ 100
METRIC RATING
282nd/ 347
METRIC RANK
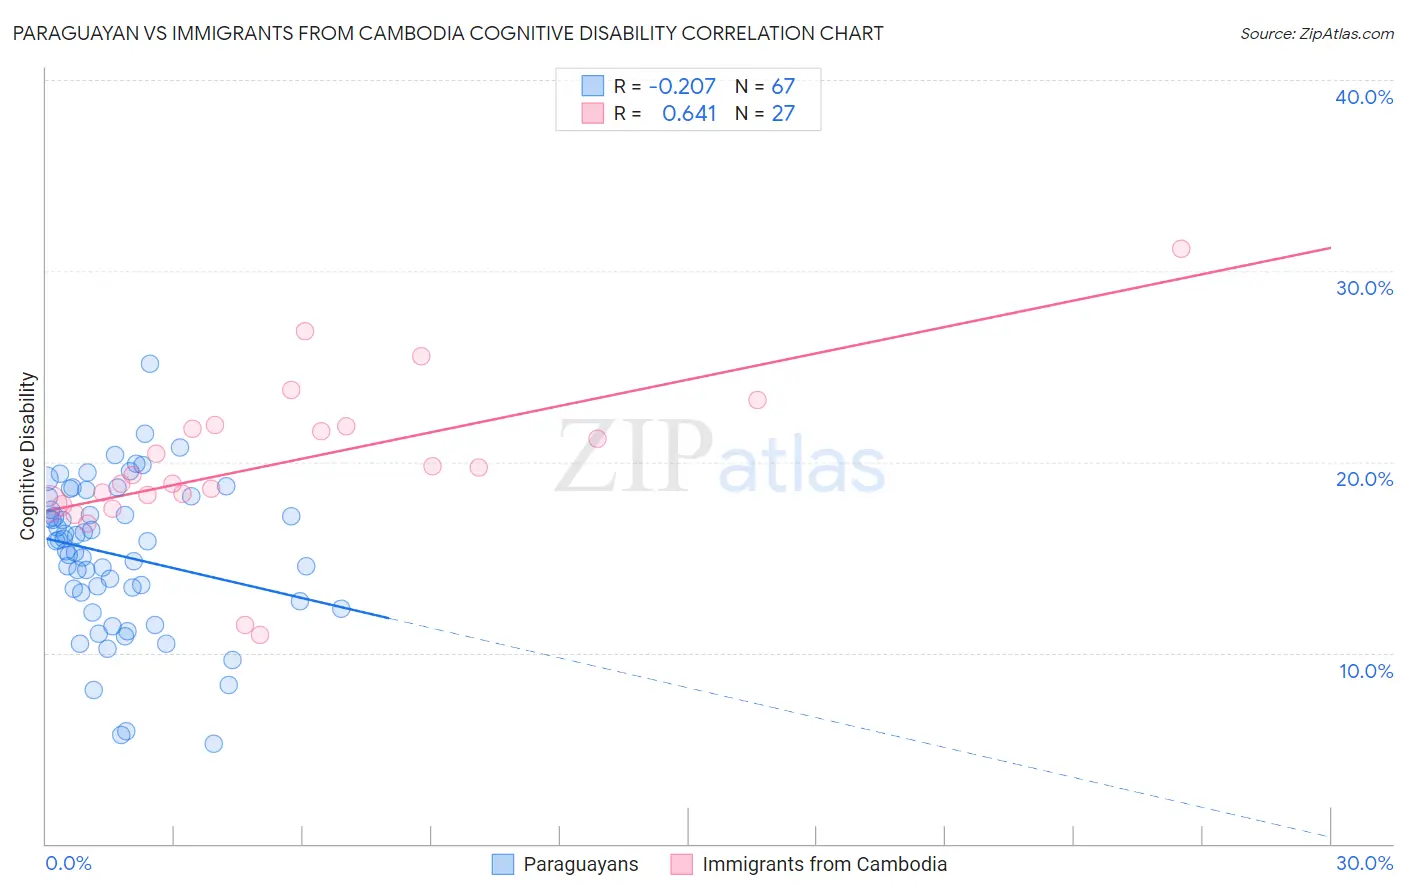
Paraguayan vs Immigrants from Cambodia Cognitive Disability Correlation Chart
The statistical analysis conducted on geographies consisting of 95,106,732 people shows a weak negative correlation between the proportion of Paraguayans and percentage of population with cognitive disability in the United States with a correlation coefficient (R) of -0.207 and weighted average of 16.8%. Similarly, the statistical analysis conducted on geographies consisting of 205,155,269 people shows a significant positive correlation between the proportion of Immigrants from Cambodia and percentage of population with cognitive disability in the United States with a correlation coefficient (R) of 0.641 and weighted average of 18.1%, a difference of 7.8%.
Cognitive Disability Correlation Summary
| Measurement | Paraguayan | Immigrants from Cambodia |
| Minimum | 5.3% | 10.9% |
| Maximum | 25.1% | 31.2% |
| Range | 19.9% | 20.2% |
| Mean | 15.1% | 20.0% |
| Median | 15.9% | 19.3% |
| Interquartile 25% (IQ1) | 12.7% | 17.8% |
| Interquartile 75% (IQ3) | 18.2% | 21.9% |
| Interquartile Range (IQR) | 5.4% | 4.1% |
| Standard Deviation (Sample) | 3.9% | 4.1% |
| Standard Deviation (Population) | 3.9% | 4.1% |
Similar Demographics by Cognitive Disability
Demographics Similar to Paraguayans by Cognitive Disability
In terms of cognitive disability, the demographic groups most similar to Paraguayans are Palestinian (16.8%, a difference of 0.0%), Immigrants from Eastern Asia (16.8%, a difference of 0.010%), Irish (16.8%, a difference of 0.050%), Northern European (16.8%, a difference of 0.050%), and Immigrants from Asia (16.8%, a difference of 0.070%).
| Demographics | Rating | Rank | Cognitive Disability |
| Finns | 98.5 /100 | #96 | Exceptional 16.8% |
| Dutch | 98.5 /100 | #97 | Exceptional 16.8% |
| Immigrants | Lebanon | 98.4 /100 | #98 | Exceptional 16.8% |
| Jordanians | 98.2 /100 | #99 | Exceptional 16.8% |
| Immigrants | Russia | 98.2 /100 | #100 | Exceptional 16.8% |
| Immigrants | Asia | 98.1 /100 | #101 | Exceptional 16.8% |
| Irish | 98.1 /100 | #102 | Exceptional 16.8% |
| Paraguayans | 98.0 /100 | #103 | Exceptional 16.8% |
| Palestinians | 98.0 /100 | #104 | Exceptional 16.8% |
| Immigrants | Eastern Asia | 97.9 /100 | #105 | Exceptional 16.8% |
| Northern Europeans | 97.8 /100 | #106 | Exceptional 16.8% |
| Immigrants | Nicaragua | 97.8 /100 | #107 | Exceptional 16.8% |
| Canadians | 97.5 /100 | #108 | Exceptional 16.8% |
| Albanians | 97.3 /100 | #109 | Exceptional 16.8% |
| Arapaho | 97.3 /100 | #110 | Exceptional 16.8% |
Demographics Similar to Immigrants from Cambodia by Cognitive Disability
In terms of cognitive disability, the demographic groups most similar to Immigrants from Cambodia are Yakama (18.1%, a difference of 0.020%), Nigerian (18.1%, a difference of 0.020%), Immigrants from Uganda (18.1%, a difference of 0.060%), Bermudan (18.1%, a difference of 0.080%), and Kenyan (18.1%, a difference of 0.11%).
| Demographics | Rating | Rank | Cognitive Disability |
| Immigrants | Laos | 0.2 /100 | #275 | Tragic 18.1% |
| Yuman | 0.2 /100 | #276 | Tragic 18.1% |
| Immigrants | Kuwait | 0.2 /100 | #277 | Tragic 18.1% |
| Immigrants | Micronesia | 0.2 /100 | #278 | Tragic 18.1% |
| Chippewa | 0.1 /100 | #279 | Tragic 18.1% |
| West Indians | 0.1 /100 | #280 | Tragic 18.1% |
| Yakama | 0.1 /100 | #281 | Tragic 18.1% |
| Immigrants | Cambodia | 0.1 /100 | #282 | Tragic 18.1% |
| Nigerians | 0.1 /100 | #283 | Tragic 18.1% |
| Immigrants | Uganda | 0.1 /100 | #284 | Tragic 18.1% |
| Bermudans | 0.1 /100 | #285 | Tragic 18.1% |
| Kenyans | 0.1 /100 | #286 | Tragic 18.1% |
| Dutch West Indians | 0.1 /100 | #287 | Tragic 18.1% |
| Immigrants | West Indies | 0.1 /100 | #288 | Tragic 18.1% |
| Natives/Alaskans | 0.1 /100 | #289 | Tragic 18.1% |