Pakistani vs Immigrants from Cambodia Cognitive Disability
COMPARE
Pakistani
Immigrants from Cambodia
Cognitive Disability
Cognitive Disability Comparison
Pakistanis
Immigrants from Cambodia
17.3%
COGNITIVE DISABILITY
43.9/ 100
METRIC RATING
180th/ 347
METRIC RANK
18.1%
COGNITIVE DISABILITY
0.1/ 100
METRIC RATING
282nd/ 347
METRIC RANK
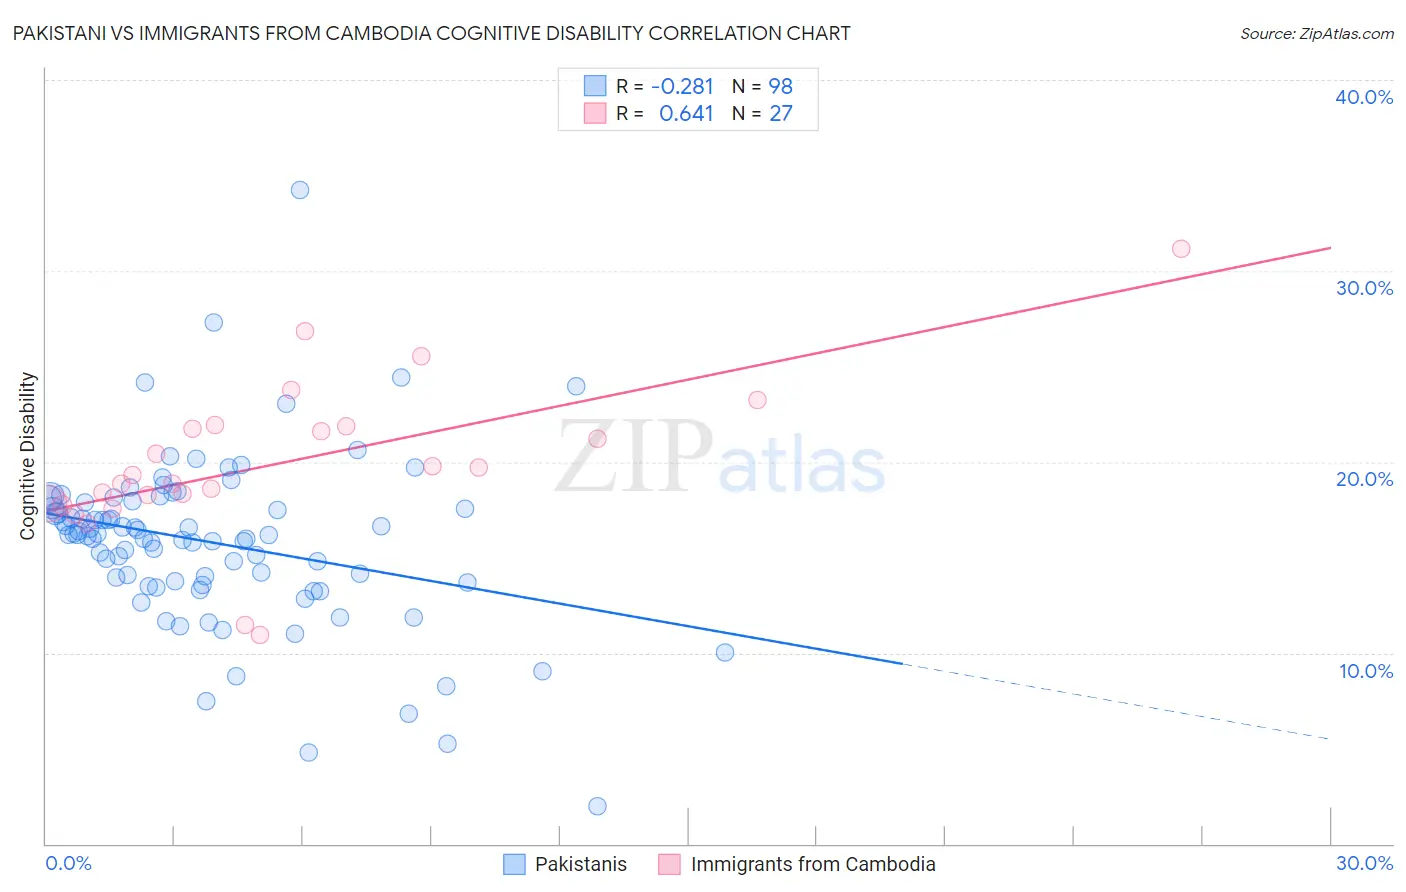
Pakistani vs Immigrants from Cambodia Cognitive Disability Correlation Chart
The statistical analysis conducted on geographies consisting of 335,302,267 people shows a weak negative correlation between the proportion of Pakistanis and percentage of population with cognitive disability in the United States with a correlation coefficient (R) of -0.281 and weighted average of 17.3%. Similarly, the statistical analysis conducted on geographies consisting of 205,155,269 people shows a significant positive correlation between the proportion of Immigrants from Cambodia and percentage of population with cognitive disability in the United States with a correlation coefficient (R) of 0.641 and weighted average of 18.1%, a difference of 4.6%.
Cognitive Disability Correlation Summary
| Measurement | Pakistani | Immigrants from Cambodia |
| Minimum | 2.0% | 10.9% |
| Maximum | 34.2% | 31.2% |
| Range | 32.2% | 20.2% |
| Mean | 15.8% | 20.0% |
| Median | 16.2% | 19.3% |
| Interquartile 25% (IQ1) | 13.7% | 17.8% |
| Interquartile 75% (IQ3) | 17.9% | 21.9% |
| Interquartile Range (IQR) | 4.2% | 4.1% |
| Standard Deviation (Sample) | 4.5% | 4.1% |
| Standard Deviation (Population) | 4.4% | 4.1% |
Similar Demographics by Cognitive Disability
Demographics Similar to Pakistanis by Cognitive Disability
In terms of cognitive disability, the demographic groups most similar to Pakistanis are Immigrants from Guyana (17.3%, a difference of 0.030%), Arab (17.3%, a difference of 0.030%), Spaniard (17.3%, a difference of 0.10%), Sioux (17.3%, a difference of 0.13%), and Spanish (17.3%, a difference of 0.14%).
| Demographics | Rating | Rank | Cognitive Disability |
| Immigrants | Northern Africa | 50.2 /100 | #173 | Average 17.3% |
| Laotians | 50.0 /100 | #174 | Average 17.3% |
| Tsimshian | 49.8 /100 | #175 | Average 17.3% |
| Shoshone | 49.2 /100 | #176 | Average 17.3% |
| Ute | 49.1 /100 | #177 | Average 17.3% |
| Spanish | 48.9 /100 | #178 | Average 17.3% |
| Sioux | 48.6 /100 | #179 | Average 17.3% |
| Pakistanis | 43.9 /100 | #180 | Average 17.3% |
| Immigrants | Guyana | 42.9 /100 | #181 | Average 17.3% |
| Arabs | 42.8 /100 | #182 | Average 17.3% |
| Spaniards | 40.3 /100 | #183 | Average 17.3% |
| Crow | 39.1 /100 | #184 | Fair 17.3% |
| Afghans | 38.2 /100 | #185 | Fair 17.3% |
| Cambodians | 35.9 /100 | #186 | Fair 17.3% |
| Immigrants | Fiji | 33.7 /100 | #187 | Fair 17.4% |
Demographics Similar to Immigrants from Cambodia by Cognitive Disability
In terms of cognitive disability, the demographic groups most similar to Immigrants from Cambodia are Yakama (18.1%, a difference of 0.020%), Nigerian (18.1%, a difference of 0.020%), Immigrants from Uganda (18.1%, a difference of 0.060%), Bermudan (18.1%, a difference of 0.080%), and Kenyan (18.1%, a difference of 0.11%).
| Demographics | Rating | Rank | Cognitive Disability |
| Immigrants | Laos | 0.2 /100 | #275 | Tragic 18.1% |
| Yuman | 0.2 /100 | #276 | Tragic 18.1% |
| Immigrants | Kuwait | 0.2 /100 | #277 | Tragic 18.1% |
| Immigrants | Micronesia | 0.2 /100 | #278 | Tragic 18.1% |
| Chippewa | 0.1 /100 | #279 | Tragic 18.1% |
| West Indians | 0.1 /100 | #280 | Tragic 18.1% |
| Yakama | 0.1 /100 | #281 | Tragic 18.1% |
| Immigrants | Cambodia | 0.1 /100 | #282 | Tragic 18.1% |
| Nigerians | 0.1 /100 | #283 | Tragic 18.1% |
| Immigrants | Uganda | 0.1 /100 | #284 | Tragic 18.1% |
| Bermudans | 0.1 /100 | #285 | Tragic 18.1% |
| Kenyans | 0.1 /100 | #286 | Tragic 18.1% |
| Dutch West Indians | 0.1 /100 | #287 | Tragic 18.1% |
| Immigrants | West Indies | 0.1 /100 | #288 | Tragic 18.1% |
| Natives/Alaskans | 0.1 /100 | #289 | Tragic 18.1% |