Immigrants from Western Asia vs Immigrants from Cambodia Cognitive Disability
COMPARE
Immigrants from Western Asia
Immigrants from Cambodia
Cognitive Disability
Cognitive Disability Comparison
Immigrants from Western Asia
Immigrants from Cambodia
17.4%
COGNITIVE DISABILITY
29.5/ 100
METRIC RATING
189th/ 347
METRIC RANK
18.1%
COGNITIVE DISABILITY
0.1/ 100
METRIC RATING
282nd/ 347
METRIC RANK
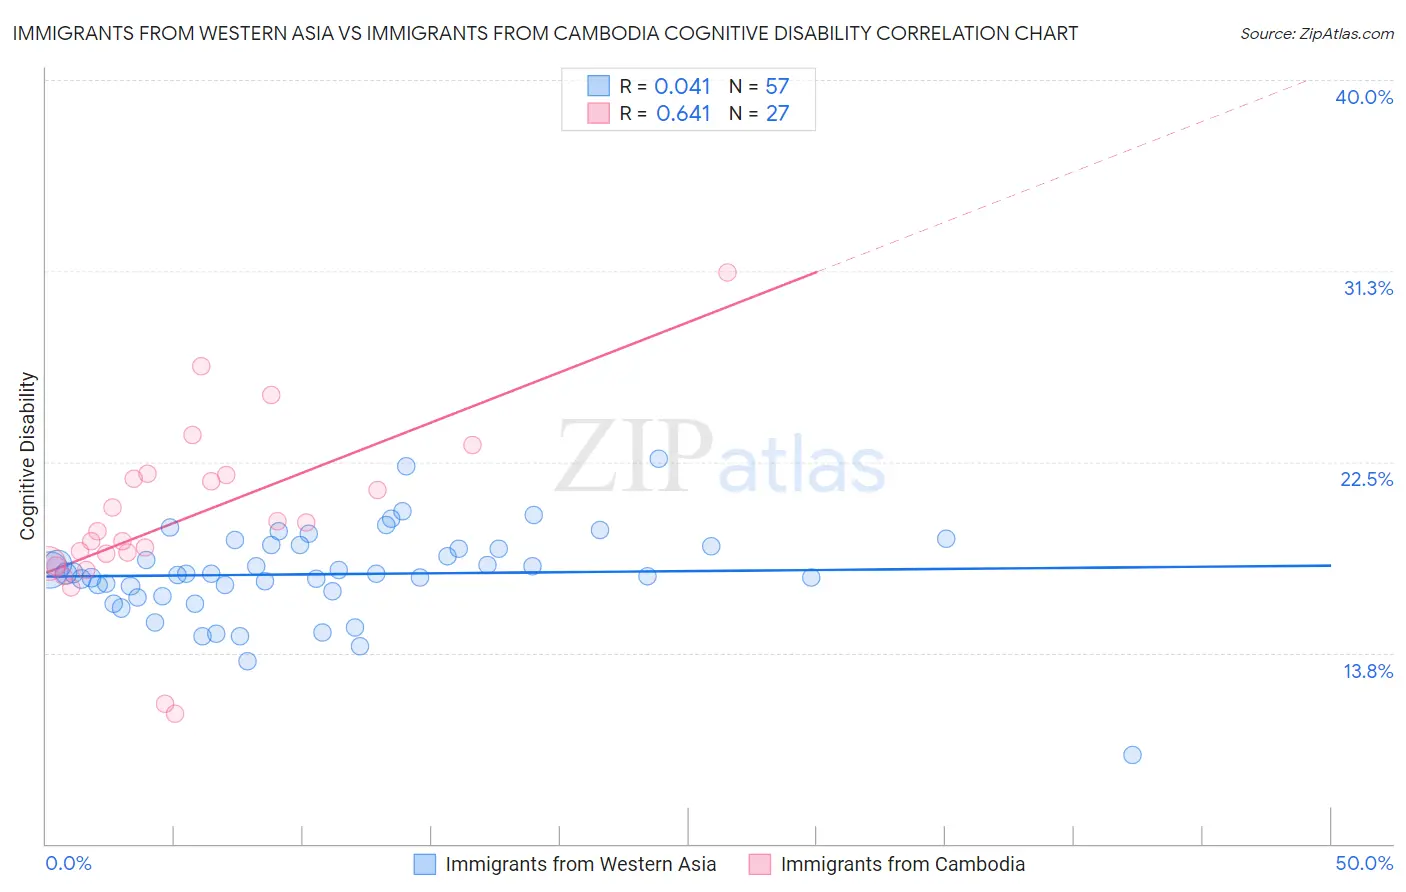
Immigrants from Western Asia vs Immigrants from Cambodia Cognitive Disability Correlation Chart
The statistical analysis conducted on geographies consisting of 404,418,073 people shows no correlation between the proportion of Immigrants from Western Asia and percentage of population with cognitive disability in the United States with a correlation coefficient (R) of 0.041 and weighted average of 17.4%. Similarly, the statistical analysis conducted on geographies consisting of 205,155,269 people shows a significant positive correlation between the proportion of Immigrants from Cambodia and percentage of population with cognitive disability in the United States with a correlation coefficient (R) of 0.641 and weighted average of 18.1%, a difference of 4.2%.
Cognitive Disability Correlation Summary
| Measurement | Immigrants from Western Asia | Immigrants from Cambodia |
| Minimum | 9.1% | 10.9% |
| Maximum | 22.7% | 31.2% |
| Range | 13.6% | 20.2% |
| Mean | 17.4% | 20.0% |
| Median | 17.4% | 19.3% |
| Interquartile 25% (IQ1) | 16.5% | 17.8% |
| Interquartile 75% (IQ3) | 18.7% | 21.9% |
| Interquartile Range (IQR) | 2.2% | 4.1% |
| Standard Deviation (Sample) | 2.1% | 4.1% |
| Standard Deviation (Population) | 2.1% | 4.1% |
Similar Demographics by Cognitive Disability
Demographics Similar to Immigrants from Western Asia by Cognitive Disability
In terms of cognitive disability, the demographic groups most similar to Immigrants from Western Asia are Immigrants from France (17.4%, a difference of 0.010%), Immigrants from Spain (17.4%, a difference of 0.060%), Nonimmigrants (17.4%, a difference of 0.070%), Immigrants from Haiti (17.4%, a difference of 0.080%), and Immigrants from Fiji (17.4%, a difference of 0.14%).
| Demographics | Rating | Rank | Cognitive Disability |
| Arabs | 42.8 /100 | #182 | Average 17.3% |
| Spaniards | 40.3 /100 | #183 | Average 17.3% |
| Crow | 39.1 /100 | #184 | Fair 17.3% |
| Afghans | 38.2 /100 | #185 | Fair 17.3% |
| Cambodians | 35.9 /100 | #186 | Fair 17.3% |
| Immigrants | Fiji | 33.7 /100 | #187 | Fair 17.4% |
| Immigrants | France | 29.8 /100 | #188 | Fair 17.4% |
| Immigrants | Western Asia | 29.5 /100 | #189 | Fair 17.4% |
| Immigrants | Spain | 27.7 /100 | #190 | Fair 17.4% |
| Immigrants | Nonimmigrants | 27.4 /100 | #191 | Fair 17.4% |
| Immigrants | Haiti | 27.1 /100 | #192 | Fair 17.4% |
| Delaware | 25.6 /100 | #193 | Fair 17.4% |
| Immigrants | Bosnia and Herzegovina | 22.0 /100 | #194 | Fair 17.4% |
| New Zealanders | 21.1 /100 | #195 | Fair 17.4% |
| Guyanese | 17.5 /100 | #196 | Poor 17.5% |
Demographics Similar to Immigrants from Cambodia by Cognitive Disability
In terms of cognitive disability, the demographic groups most similar to Immigrants from Cambodia are Yakama (18.1%, a difference of 0.020%), Nigerian (18.1%, a difference of 0.020%), Immigrants from Uganda (18.1%, a difference of 0.060%), Bermudan (18.1%, a difference of 0.080%), and Kenyan (18.1%, a difference of 0.11%).
| Demographics | Rating | Rank | Cognitive Disability |
| Immigrants | Laos | 0.2 /100 | #275 | Tragic 18.1% |
| Yuman | 0.2 /100 | #276 | Tragic 18.1% |
| Immigrants | Kuwait | 0.2 /100 | #277 | Tragic 18.1% |
| Immigrants | Micronesia | 0.2 /100 | #278 | Tragic 18.1% |
| Chippewa | 0.1 /100 | #279 | Tragic 18.1% |
| West Indians | 0.1 /100 | #280 | Tragic 18.1% |
| Yakama | 0.1 /100 | #281 | Tragic 18.1% |
| Immigrants | Cambodia | 0.1 /100 | #282 | Tragic 18.1% |
| Nigerians | 0.1 /100 | #283 | Tragic 18.1% |
| Immigrants | Uganda | 0.1 /100 | #284 | Tragic 18.1% |
| Bermudans | 0.1 /100 | #285 | Tragic 18.1% |
| Kenyans | 0.1 /100 | #286 | Tragic 18.1% |
| Dutch West Indians | 0.1 /100 | #287 | Tragic 18.1% |
| Immigrants | West Indies | 0.1 /100 | #288 | Tragic 18.1% |
| Natives/Alaskans | 0.1 /100 | #289 | Tragic 18.1% |