Assyrian/Chaldean/Syriac vs Maltese Disability Age 18 to 34
COMPARE
Assyrian/Chaldean/Syriac
Maltese
Disability Age 18 to 34
Disability Age 18 to 34 Comparison
Assyrians/Chaldeans/Syriacs
Maltese
6.1%
DISABILITY AGE 18 TO 34
98.9/ 100
METRIC RATING
78th/ 347
METRIC RANK
6.7%
DISABILITY AGE 18 TO 34
34.8/ 100
METRIC RATING
187th/ 347
METRIC RANK
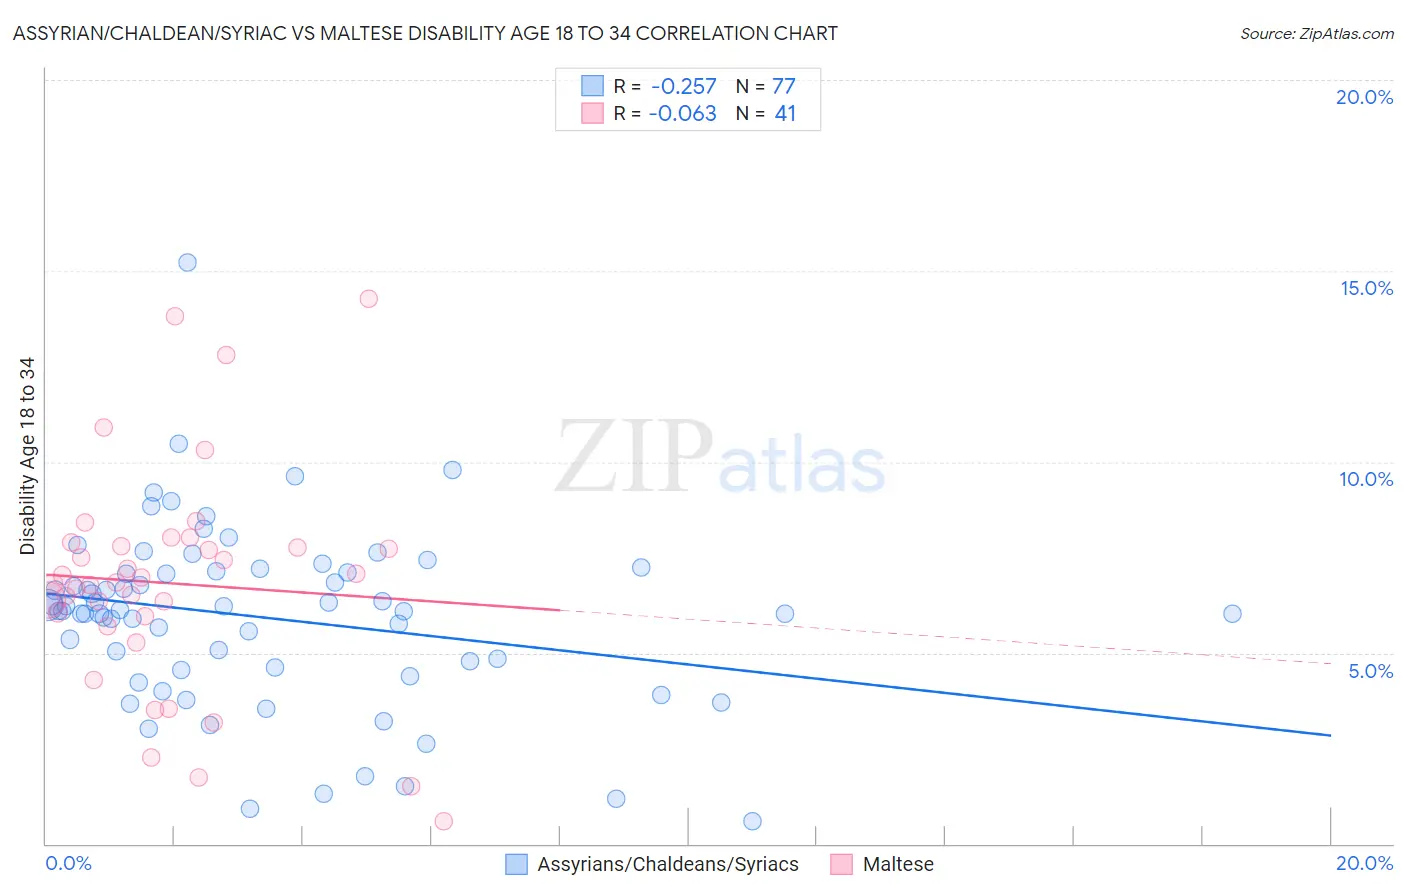
Assyrian/Chaldean/Syriac vs Maltese Disability Age 18 to 34 Correlation Chart
The statistical analysis conducted on geographies consisting of 110,269,916 people shows a weak negative correlation between the proportion of Assyrians/Chaldeans/Syriacs and percentage of population with a disability between the ages 18 and 35 in the United States with a correlation coefficient (R) of -0.257 and weighted average of 6.1%. Similarly, the statistical analysis conducted on geographies consisting of 126,387,990 people shows a slight negative correlation between the proportion of Maltese and percentage of population with a disability between the ages 18 and 35 in the United States with a correlation coefficient (R) of -0.063 and weighted average of 6.7%, a difference of 9.6%.
Disability Age 18 to 34 Correlation Summary
| Measurement | Assyrian/Chaldean/Syriac | Maltese |
| Minimum | 0.58% | 0.59% |
| Maximum | 15.2% | 14.3% |
| Range | 14.6% | 13.7% |
| Mean | 5.9% | 6.8% |
| Median | 6.1% | 6.8% |
| Interquartile 25% (IQ1) | 4.6% | 5.8% |
| Interquartile 75% (IQ3) | 7.1% | 7.8% |
| Interquartile Range (IQR) | 2.5% | 2.0% |
| Standard Deviation (Sample) | 2.4% | 2.9% |
| Standard Deviation (Population) | 2.3% | 2.9% |
Similar Demographics by Disability Age 18 to 34
Demographics Similar to Assyrians/Chaldeans/Syriacs by Disability Age 18 to 34
In terms of disability age 18 to 34, the demographic groups most similar to Assyrians/Chaldeans/Syriacs are Immigrants from Russia (6.1%, a difference of 0.0%), Immigrants from Western Asia (6.1%, a difference of 0.10%), Afghan (6.1%, a difference of 0.29%), Immigrants from Turkey (6.1%, a difference of 0.38%), and Immigrants from Chile (6.1%, a difference of 0.49%).
| Demographics | Rating | Rank | Disability Age 18 to 34 |
| Immigrants | Japan | 99.3 /100 | #71 | Exceptional 6.0% |
| Immigrants | Lebanon | 99.2 /100 | #72 | Exceptional 6.0% |
| Cypriots | 99.2 /100 | #73 | Exceptional 6.0% |
| Haitians | 99.2 /100 | #74 | Exceptional 6.0% |
| Immigrants | Turkey | 99.1 /100 | #75 | Exceptional 6.1% |
| Immigrants | Western Asia | 98.9 /100 | #76 | Exceptional 6.1% |
| Immigrants | Russia | 98.9 /100 | #77 | Exceptional 6.1% |
| Assyrians/Chaldeans/Syriacs | 98.9 /100 | #78 | Exceptional 6.1% |
| Afghans | 98.7 /100 | #79 | Exceptional 6.1% |
| Immigrants | Chile | 98.5 /100 | #80 | Exceptional 6.1% |
| Immigrants | Australia | 98.5 /100 | #81 | Exceptional 6.1% |
| Immigrants | Northern Africa | 98.4 /100 | #82 | Exceptional 6.1% |
| Barbadians | 98.3 /100 | #83 | Exceptional 6.1% |
| Israelis | 98.3 /100 | #84 | Exceptional 6.1% |
| Immigrants | Ireland | 98.2 /100 | #85 | Exceptional 6.1% |
Demographics Similar to Maltese by Disability Age 18 to 34
In terms of disability age 18 to 34, the demographic groups most similar to Maltese are Immigrants from Cameroon (6.7%, a difference of 0.020%), Immigrants from Oceania (6.7%, a difference of 0.040%), Yup'ik (6.7%, a difference of 0.040%), Pakistani (6.7%, a difference of 0.090%), and Immigrants from Zimbabwe (6.7%, a difference of 0.090%).
| Demographics | Rating | Rank | Disability Age 18 to 34 |
| Immigrants | Austria | 39.6 /100 | #180 | Fair 6.6% |
| Romanians | 39.5 /100 | #181 | Fair 6.6% |
| U.S. Virgin Islanders | 38.6 /100 | #182 | Fair 6.7% |
| Immigrants | Iraq | 37.4 /100 | #183 | Fair 6.7% |
| Iraqis | 37.4 /100 | #184 | Fair 6.7% |
| Immigrants | Oceania | 35.4 /100 | #185 | Fair 6.7% |
| Yup'ik | 35.3 /100 | #186 | Fair 6.7% |
| Maltese | 34.8 /100 | #187 | Fair 6.7% |
| Immigrants | Cameroon | 34.5 /100 | #188 | Fair 6.7% |
| Pakistanis | 33.7 /100 | #189 | Fair 6.7% |
| Immigrants | Zimbabwe | 33.6 /100 | #190 | Fair 6.7% |
| Immigrants | Eastern Africa | 33.2 /100 | #191 | Fair 6.7% |
| Immigrants | Western Africa | 28.3 /100 | #192 | Fair 6.7% |
| Immigrants | Uganda | 25.1 /100 | #193 | Fair 6.7% |
| Immigrants | Sudan | 24.9 /100 | #194 | Fair 6.7% |