Assyrian/Chaldean/Syriac vs Potawatomi Disability Age 18 to 34
COMPARE
Assyrian/Chaldean/Syriac
Potawatomi
Disability Age 18 to 34
Disability Age 18 to 34 Comparison
Assyrians/Chaldeans/Syriacs
Potawatomi
6.1%
DISABILITY AGE 18 TO 34
98.9/ 100
METRIC RATING
78th/ 347
METRIC RANK
8.2%
DISABILITY AGE 18 TO 34
0.0/ 100
METRIC RATING
326th/ 347
METRIC RANK
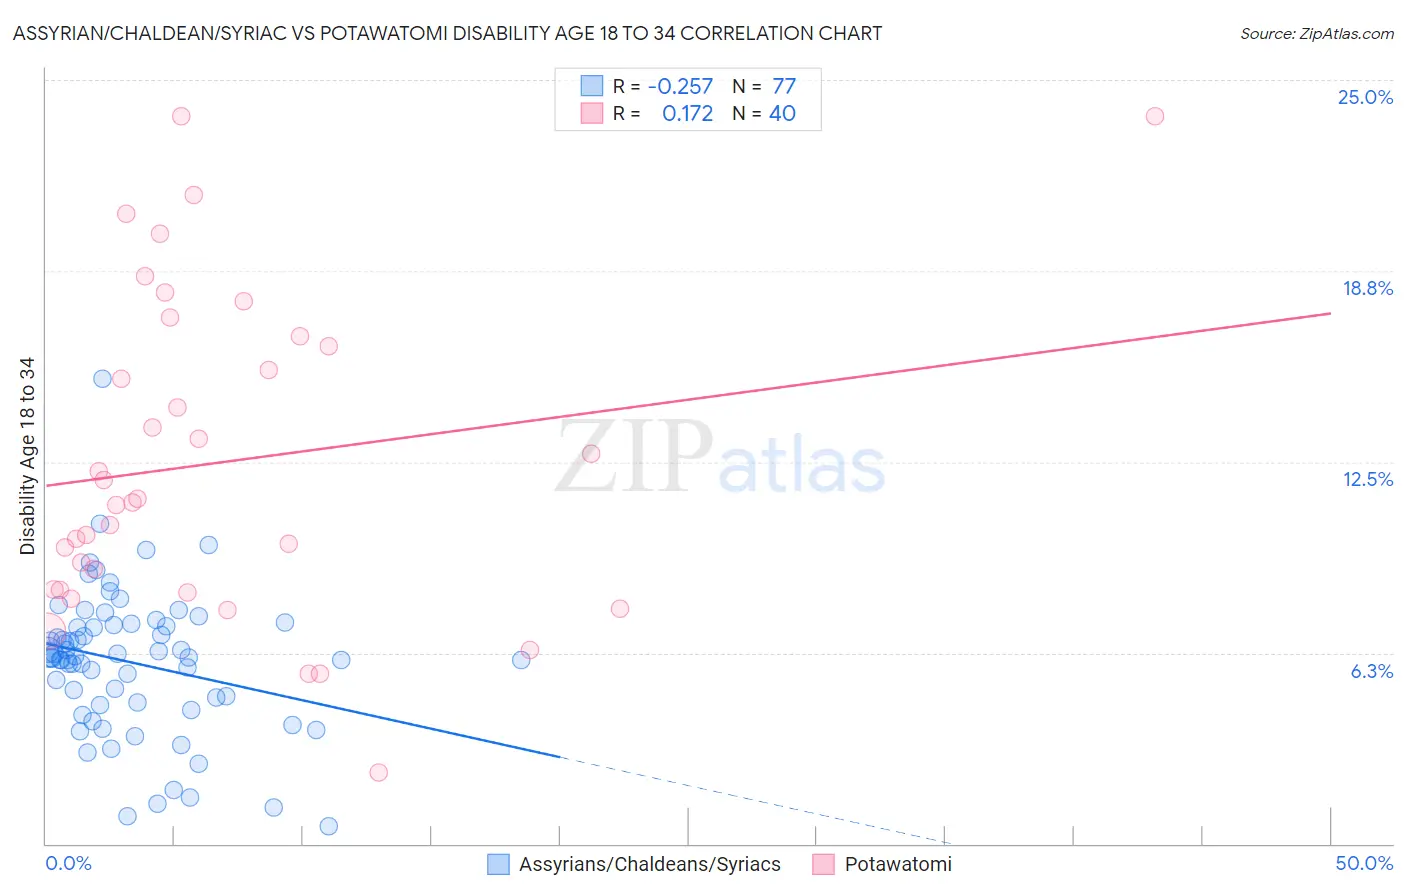
Assyrian/Chaldean/Syriac vs Potawatomi Disability Age 18 to 34 Correlation Chart
The statistical analysis conducted on geographies consisting of 110,269,916 people shows a weak negative correlation between the proportion of Assyrians/Chaldeans/Syriacs and percentage of population with a disability between the ages 18 and 35 in the United States with a correlation coefficient (R) of -0.257 and weighted average of 6.1%. Similarly, the statistical analysis conducted on geographies consisting of 117,634,841 people shows a poor positive correlation between the proportion of Potawatomi and percentage of population with a disability between the ages 18 and 35 in the United States with a correlation coefficient (R) of 0.172 and weighted average of 8.2%, a difference of 35.0%.
Disability Age 18 to 34 Correlation Summary
| Measurement | Assyrian/Chaldean/Syriac | Potawatomi |
| Minimum | 0.58% | 2.3% |
| Maximum | 15.2% | 23.8% |
| Range | 14.6% | 21.5% |
| Mean | 5.9% | 12.5% |
| Median | 6.1% | 11.2% |
| Interquartile 25% (IQ1) | 4.6% | 8.3% |
| Interquartile 75% (IQ3) | 7.1% | 16.5% |
| Interquartile Range (IQR) | 2.5% | 8.1% |
| Standard Deviation (Sample) | 2.4% | 5.2% |
| Standard Deviation (Population) | 2.3% | 5.2% |
Similar Demographics by Disability Age 18 to 34
Demographics Similar to Assyrians/Chaldeans/Syriacs by Disability Age 18 to 34
In terms of disability age 18 to 34, the demographic groups most similar to Assyrians/Chaldeans/Syriacs are Immigrants from Russia (6.1%, a difference of 0.0%), Immigrants from Western Asia (6.1%, a difference of 0.10%), Afghan (6.1%, a difference of 0.29%), Immigrants from Turkey (6.1%, a difference of 0.38%), and Immigrants from Chile (6.1%, a difference of 0.49%).
| Demographics | Rating | Rank | Disability Age 18 to 34 |
| Immigrants | Japan | 99.3 /100 | #71 | Exceptional 6.0% |
| Immigrants | Lebanon | 99.2 /100 | #72 | Exceptional 6.0% |
| Cypriots | 99.2 /100 | #73 | Exceptional 6.0% |
| Haitians | 99.2 /100 | #74 | Exceptional 6.0% |
| Immigrants | Turkey | 99.1 /100 | #75 | Exceptional 6.1% |
| Immigrants | Western Asia | 98.9 /100 | #76 | Exceptional 6.1% |
| Immigrants | Russia | 98.9 /100 | #77 | Exceptional 6.1% |
| Assyrians/Chaldeans/Syriacs | 98.9 /100 | #78 | Exceptional 6.1% |
| Afghans | 98.7 /100 | #79 | Exceptional 6.1% |
| Immigrants | Chile | 98.5 /100 | #80 | Exceptional 6.1% |
| Immigrants | Australia | 98.5 /100 | #81 | Exceptional 6.1% |
| Immigrants | Northern Africa | 98.4 /100 | #82 | Exceptional 6.1% |
| Barbadians | 98.3 /100 | #83 | Exceptional 6.1% |
| Israelis | 98.3 /100 | #84 | Exceptional 6.1% |
| Immigrants | Ireland | 98.2 /100 | #85 | Exceptional 6.1% |
Demographics Similar to Potawatomi by Disability Age 18 to 34
In terms of disability age 18 to 34, the demographic groups most similar to Potawatomi are Native/Alaskan (8.2%, a difference of 0.020%), Sioux (8.2%, a difference of 0.13%), Delaware (8.2%, a difference of 0.17%), Cajun (8.2%, a difference of 0.54%), and French American Indian (8.2%, a difference of 0.58%).
| Demographics | Rating | Rank | Disability Age 18 to 34 |
| Aleuts | 0.0 /100 | #319 | Tragic 8.1% |
| Navajo | 0.0 /100 | #320 | Tragic 8.1% |
| Blackfeet | 0.0 /100 | #321 | Tragic 8.1% |
| Cree | 0.0 /100 | #322 | Tragic 8.1% |
| French American Indians | 0.0 /100 | #323 | Tragic 8.2% |
| Cajuns | 0.0 /100 | #324 | Tragic 8.2% |
| Natives/Alaskans | 0.0 /100 | #325 | Tragic 8.2% |
| Potawatomi | 0.0 /100 | #326 | Tragic 8.2% |
| Sioux | 0.0 /100 | #327 | Tragic 8.2% |
| Delaware | 0.0 /100 | #328 | Tragic 8.2% |
| Crow | 0.0 /100 | #329 | Tragic 8.3% |
| Osage | 0.0 /100 | #330 | Tragic 8.3% |
| Comanche | 0.0 /100 | #331 | Tragic 8.3% |
| Puget Sound Salish | 0.0 /100 | #332 | Tragic 8.3% |
| Apache | 0.0 /100 | #333 | Tragic 8.4% |