Assyrian/Chaldean/Syriac vs Russian Disability Age 18 to 34
COMPARE
Assyrian/Chaldean/Syriac
Russian
Disability Age 18 to 34
Disability Age 18 to 34 Comparison
Assyrians/Chaldeans/Syriacs
Russians
6.1%
DISABILITY AGE 18 TO 34
98.9/ 100
METRIC RATING
78th/ 347
METRIC RANK
6.5%
DISABILITY AGE 18 TO 34
60.2/ 100
METRIC RATING
169th/ 347
METRIC RANK
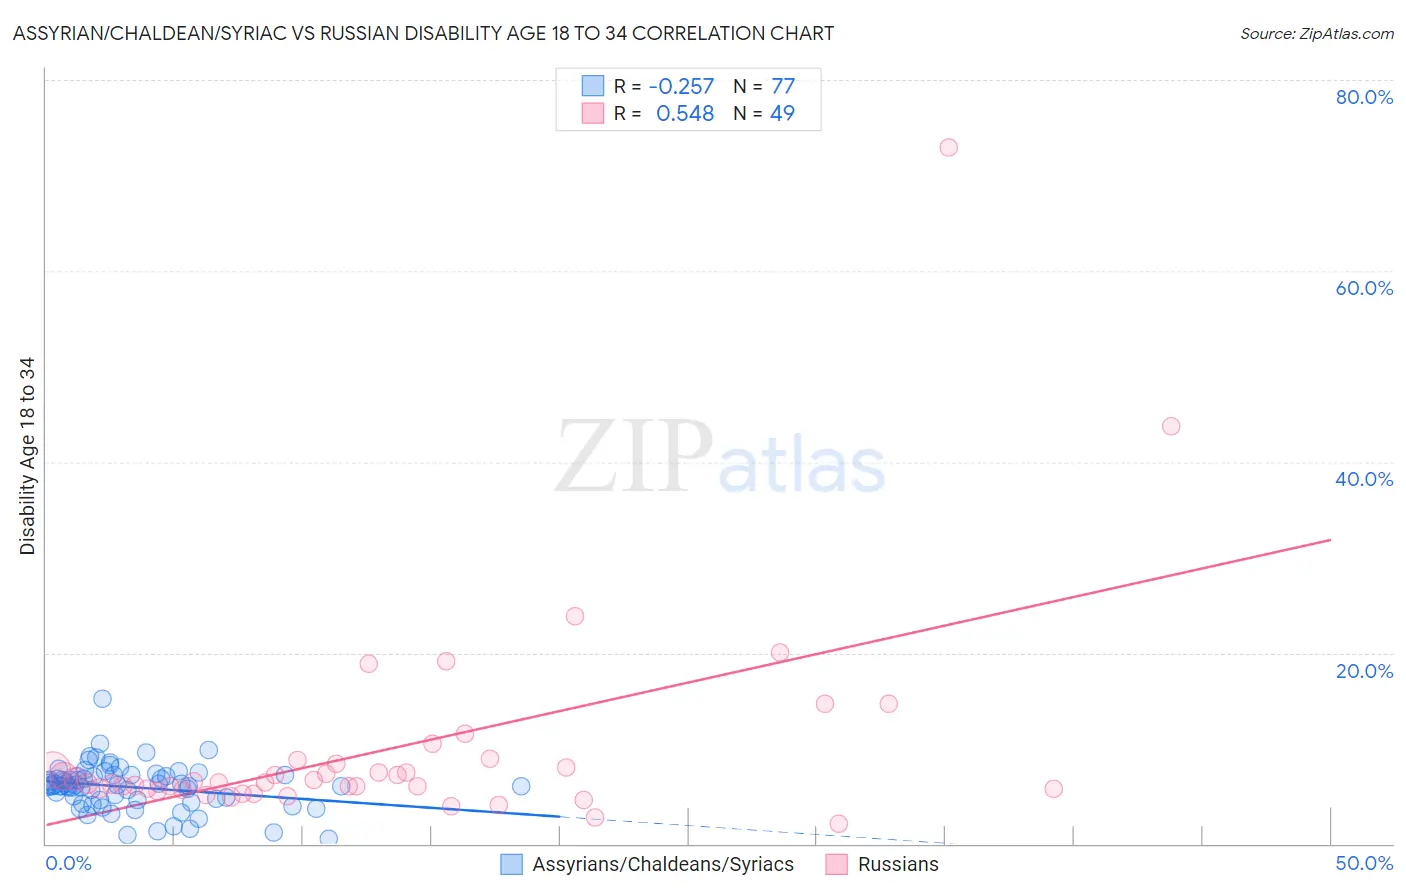
Assyrian/Chaldean/Syriac vs Russian Disability Age 18 to 34 Correlation Chart
The statistical analysis conducted on geographies consisting of 110,269,916 people shows a weak negative correlation between the proportion of Assyrians/Chaldeans/Syriacs and percentage of population with a disability between the ages 18 and 35 in the United States with a correlation coefficient (R) of -0.257 and weighted average of 6.1%. Similarly, the statistical analysis conducted on geographies consisting of 509,184,365 people shows a substantial positive correlation between the proportion of Russians and percentage of population with a disability between the ages 18 and 35 in the United States with a correlation coefficient (R) of 0.548 and weighted average of 6.5%, a difference of 7.6%.
Disability Age 18 to 34 Correlation Summary
| Measurement | Assyrian/Chaldean/Syriac | Russian |
| Minimum | 0.58% | 2.1% |
| Maximum | 15.2% | 72.9% |
| Range | 14.6% | 70.8% |
| Mean | 5.9% | 10.0% |
| Median | 6.1% | 6.4% |
| Interquartile 25% (IQ1) | 4.6% | 5.7% |
| Interquartile 75% (IQ3) | 7.1% | 8.6% |
| Interquartile Range (IQR) | 2.5% | 2.9% |
| Standard Deviation (Sample) | 2.4% | 11.4% |
| Standard Deviation (Population) | 2.3% | 11.3% |
Similar Demographics by Disability Age 18 to 34
Demographics Similar to Assyrians/Chaldeans/Syriacs by Disability Age 18 to 34
In terms of disability age 18 to 34, the demographic groups most similar to Assyrians/Chaldeans/Syriacs are Immigrants from Russia (6.1%, a difference of 0.0%), Immigrants from Western Asia (6.1%, a difference of 0.10%), Afghan (6.1%, a difference of 0.29%), Immigrants from Turkey (6.1%, a difference of 0.38%), and Immigrants from Chile (6.1%, a difference of 0.49%).
| Demographics | Rating | Rank | Disability Age 18 to 34 |
| Immigrants | Japan | 99.3 /100 | #71 | Exceptional 6.0% |
| Immigrants | Lebanon | 99.2 /100 | #72 | Exceptional 6.0% |
| Cypriots | 99.2 /100 | #73 | Exceptional 6.0% |
| Haitians | 99.2 /100 | #74 | Exceptional 6.0% |
| Immigrants | Turkey | 99.1 /100 | #75 | Exceptional 6.1% |
| Immigrants | Western Asia | 98.9 /100 | #76 | Exceptional 6.1% |
| Immigrants | Russia | 98.9 /100 | #77 | Exceptional 6.1% |
| Assyrians/Chaldeans/Syriacs | 98.9 /100 | #78 | Exceptional 6.1% |
| Afghans | 98.7 /100 | #79 | Exceptional 6.1% |
| Immigrants | Chile | 98.5 /100 | #80 | Exceptional 6.1% |
| Immigrants | Australia | 98.5 /100 | #81 | Exceptional 6.1% |
| Immigrants | Northern Africa | 98.4 /100 | #82 | Exceptional 6.1% |
| Barbadians | 98.3 /100 | #83 | Exceptional 6.1% |
| Israelis | 98.3 /100 | #84 | Exceptional 6.1% |
| Immigrants | Ireland | 98.2 /100 | #85 | Exceptional 6.1% |
Demographics Similar to Russians by Disability Age 18 to 34
In terms of disability age 18 to 34, the demographic groups most similar to Russians are Immigrants from Bahamas (6.6%, a difference of 0.17%), Immigrants from Moldova (6.5%, a difference of 0.21%), Immigrants from Northern Europe (6.5%, a difference of 0.29%), Bahamian (6.6%, a difference of 0.34%), and Eastern European (6.5%, a difference of 0.37%).
| Demographics | Rating | Rank | Disability Age 18 to 34 |
| South Africans | 71.7 /100 | #162 | Good 6.5% |
| Immigrants | Denmark | 71.7 /100 | #163 | Good 6.5% |
| Immigrants | Nigeria | 70.4 /100 | #164 | Good 6.5% |
| Immigrants | Hungary | 69.6 /100 | #165 | Good 6.5% |
| Eastern Europeans | 65.1 /100 | #166 | Good 6.5% |
| Immigrants | Northern Europe | 64.1 /100 | #167 | Good 6.5% |
| Immigrants | Moldova | 63.1 /100 | #168 | Good 6.5% |
| Russians | 60.2 /100 | #169 | Good 6.5% |
| Immigrants | Bahamas | 57.9 /100 | #170 | Average 6.6% |
| Bahamians | 55.5 /100 | #171 | Average 6.6% |
| Ghanaians | 54.7 /100 | #172 | Average 6.6% |
| Immigrants | Mexico | 54.1 /100 | #173 | Average 6.6% |
| Native Hawaiians | 50.0 /100 | #174 | Average 6.6% |
| Immigrants | Cambodia | 46.5 /100 | #175 | Average 6.6% |
| Immigrants | Africa | 45.9 /100 | #176 | Average 6.6% |