Assyrian/Chaldean/Syriac vs Maltese Unemployment Among Seniors over 75 years
COMPARE
Assyrian/Chaldean/Syriac
Maltese
Unemployment Among Seniors over 75 years
Unemployment Among Seniors over 75 years Comparison
Assyrians/Chaldeans/Syriacs
Maltese
11.1%
UNEMPLOYMENT AMONG SENIORS OVER 75 YEARS
0.0/ 100
METRIC RATING
334th/ 347
METRIC RANK
8.8%
UNEMPLOYMENT AMONG SENIORS OVER 75 YEARS
29.2/ 100
METRIC RATING
194th/ 347
METRIC RANK
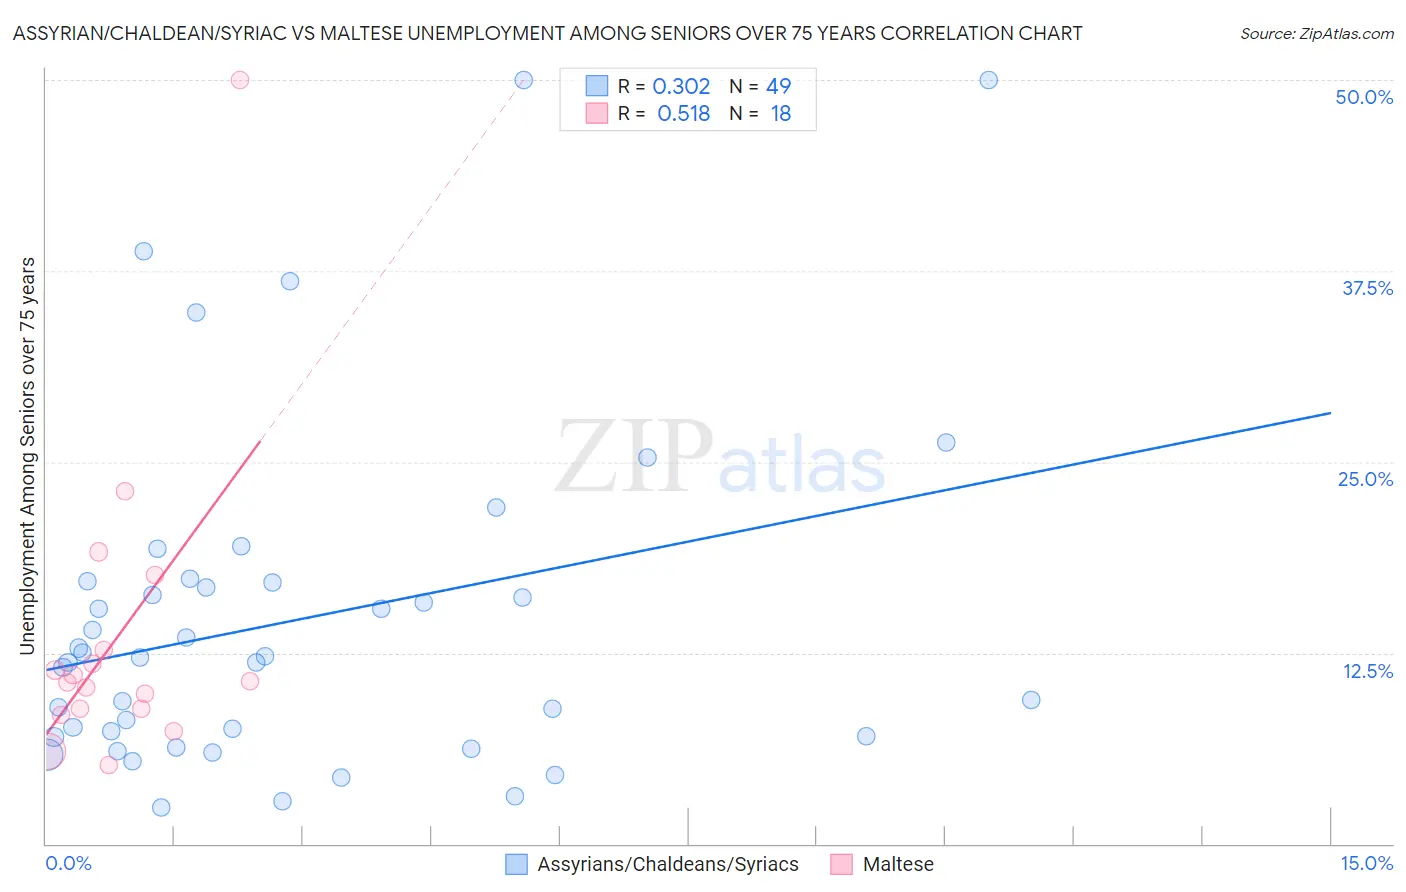
Assyrian/Chaldean/Syriac vs Maltese Unemployment Among Seniors over 75 years Correlation Chart
The statistical analysis conducted on geographies consisting of 82,071,113 people shows a mild positive correlation between the proportion of Assyrians/Chaldeans/Syriacs and unemployment rate among seniors over the age of 75 in the United States with a correlation coefficient (R) of 0.302 and weighted average of 11.1%. Similarly, the statistical analysis conducted on geographies consisting of 91,135,025 people shows a substantial positive correlation between the proportion of Maltese and unemployment rate among seniors over the age of 75 in the United States with a correlation coefficient (R) of 0.518 and weighted average of 8.8%, a difference of 24.9%.
Unemployment Among Seniors over 75 years Correlation Summary
| Measurement | Assyrian/Chaldean/Syriac | Maltese |
| Minimum | 2.4% | 5.1% |
| Maximum | 50.0% | 50.0% |
| Range | 47.6% | 44.9% |
| Mean | 14.6% | 13.5% |
| Median | 12.2% | 10.6% |
| Interquartile 25% (IQ1) | 7.0% | 8.8% |
| Interquartile 75% (IQ3) | 17.2% | 12.6% |
| Interquartile Range (IQR) | 10.2% | 3.8% |
| Standard Deviation (Sample) | 11.1% | 10.2% |
| Standard Deviation (Population) | 11.0% | 9.9% |
Similar Demographics by Unemployment Among Seniors over 75 years
Demographics Similar to Assyrians/Chaldeans/Syriacs by Unemployment Among Seniors over 75 years
In terms of unemployment among seniors over 75 years, the demographic groups most similar to Assyrians/Chaldeans/Syriacs are Alaskan Athabascan (11.0%, a difference of 0.35%), French Canadian (11.2%, a difference of 1.1%), Immigrants from Liberia (10.9%, a difference of 1.5%), Tohono O'odham (10.8%, a difference of 2.2%), and Immigrants from North Macedonia (11.3%, a difference of 2.3%).
| Demographics | Rating | Rank | Unemployment Among Seniors over 75 years |
| Dutch | 0.0 /100 | #327 | Tragic 10.4% |
| Immigrants | Portugal | 0.0 /100 | #328 | Tragic 10.5% |
| Tsimshian | 0.0 /100 | #329 | Tragic 10.5% |
| Immigrants | Azores | 0.0 /100 | #330 | Tragic 10.7% |
| Tohono O'odham | 0.0 /100 | #331 | Tragic 10.8% |
| Immigrants | Liberia | 0.0 /100 | #332 | Tragic 10.9% |
| Alaskan Athabascans | 0.0 /100 | #333 | Tragic 11.0% |
| Assyrians/Chaldeans/Syriacs | 0.0 /100 | #334 | Tragic 11.1% |
| French Canadians | 0.0 /100 | #335 | Tragic 11.2% |
| Immigrants | North Macedonia | 0.0 /100 | #336 | Tragic 11.3% |
| Cape Verdeans | 0.0 /100 | #337 | Tragic 11.4% |
| Immigrants | Cabo Verde | 0.0 /100 | #338 | Tragic 12.3% |
| Cajuns | 0.0 /100 | #339 | Tragic 12.5% |
| Yup'ik | 0.0 /100 | #340 | Tragic 12.8% |
| Lumbee | 0.0 /100 | #341 | Tragic 13.5% |
Demographics Similar to Maltese by Unemployment Among Seniors over 75 years
In terms of unemployment among seniors over 75 years, the demographic groups most similar to Maltese are Okinawan (8.8%, a difference of 0.020%), Immigrants from Guyana (8.8%, a difference of 0.050%), Immigrants from Jamaica (8.9%, a difference of 0.090%), Immigrants from Kenya (8.8%, a difference of 0.17%), and Immigrants from Laos (8.9%, a difference of 0.19%).
| Demographics | Rating | Rank | Unemployment Among Seniors over 75 years |
| Immigrants | Europe | 35.2 /100 | #187 | Fair 8.8% |
| Immigrants | Eastern Europe | 34.7 /100 | #188 | Fair 8.8% |
| Immigrants | Haiti | 34.7 /100 | #189 | Fair 8.8% |
| Mexican American Indians | 34.7 /100 | #190 | Fair 8.8% |
| Estonians | 33.3 /100 | #191 | Fair 8.8% |
| Immigrants | Kenya | 31.8 /100 | #192 | Fair 8.8% |
| Immigrants | Guyana | 29.9 /100 | #193 | Fair 8.8% |
| Maltese | 29.2 /100 | #194 | Fair 8.8% |
| Okinawans | 28.9 /100 | #195 | Fair 8.8% |
| Immigrants | Jamaica | 27.7 /100 | #196 | Fair 8.9% |
| Immigrants | Laos | 26.3 /100 | #197 | Fair 8.9% |
| Eastern Europeans | 25.9 /100 | #198 | Fair 8.9% |
| Pakistanis | 25.4 /100 | #199 | Fair 8.9% |
| Osage | 25.4 /100 | #200 | Fair 8.9% |
| Immigrants | Peru | 24.3 /100 | #201 | Fair 8.9% |