Bahamian vs Maltese Disability Age 18 to 34
COMPARE
Bahamian
Maltese
Disability Age 18 to 34
Disability Age 18 to 34 Comparison
Bahamians
Maltese
6.6%
DISABILITY AGE 18 TO 34
55.5/ 100
METRIC RATING
171st/ 347
METRIC RANK
6.7%
DISABILITY AGE 18 TO 34
34.8/ 100
METRIC RATING
187th/ 347
METRIC RANK
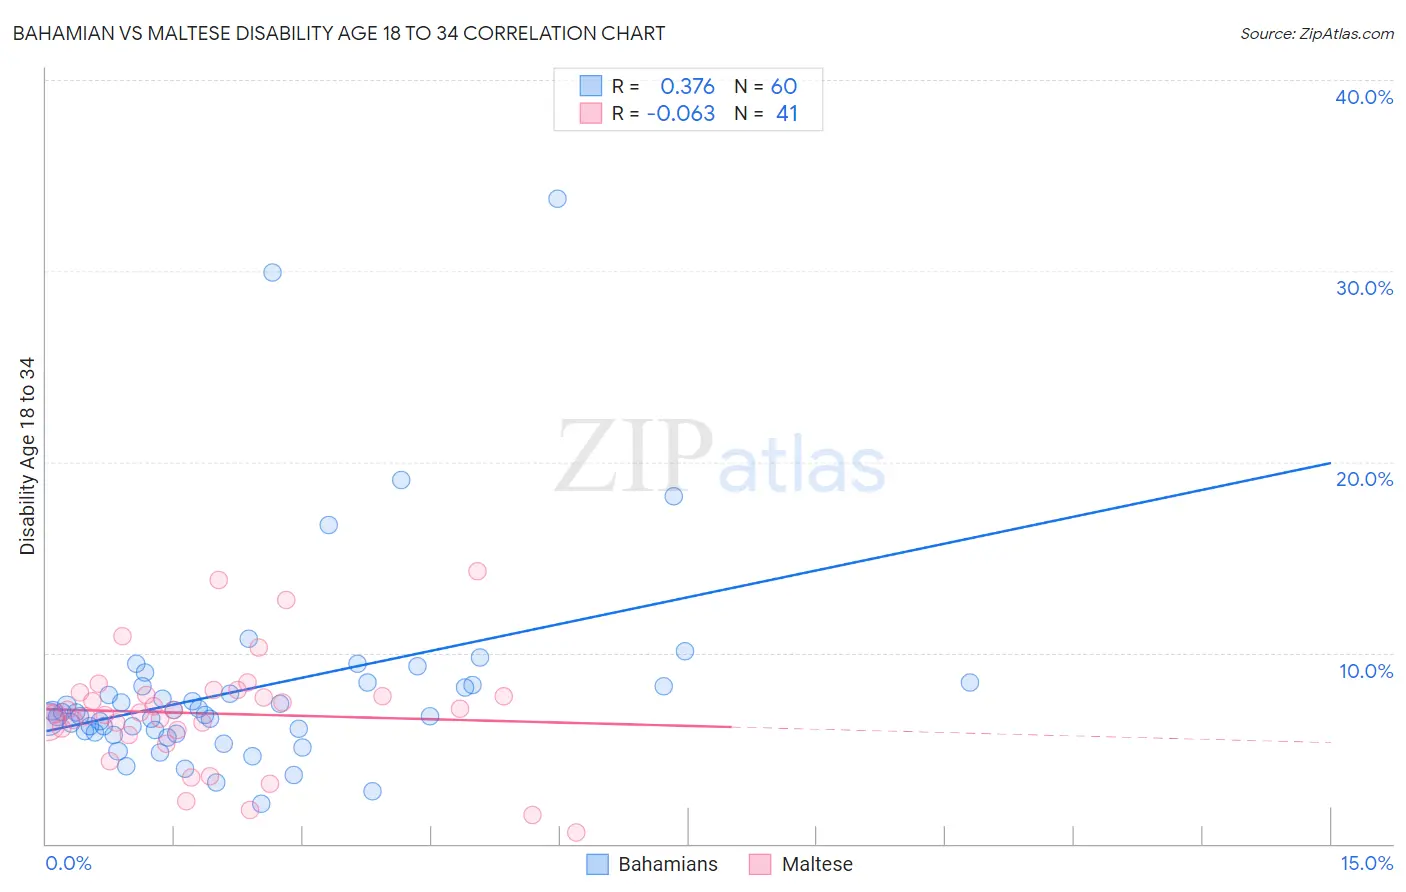
Bahamian vs Maltese Disability Age 18 to 34 Correlation Chart
The statistical analysis conducted on geographies consisting of 112,638,340 people shows a mild positive correlation between the proportion of Bahamians and percentage of population with a disability between the ages 18 and 35 in the United States with a correlation coefficient (R) of 0.376 and weighted average of 6.6%. Similarly, the statistical analysis conducted on geographies consisting of 126,387,990 people shows a slight negative correlation between the proportion of Maltese and percentage of population with a disability between the ages 18 and 35 in the United States with a correlation coefficient (R) of -0.063 and weighted average of 6.7%, a difference of 1.5%.
Disability Age 18 to 34 Correlation Summary
| Measurement | Bahamian | Maltese |
| Minimum | 2.1% | 0.59% |
| Maximum | 33.8% | 14.3% |
| Range | 31.7% | 13.7% |
| Mean | 8.1% | 6.8% |
| Median | 6.8% | 6.8% |
| Interquartile 25% (IQ1) | 5.9% | 5.8% |
| Interquartile 75% (IQ3) | 8.3% | 7.8% |
| Interquartile Range (IQR) | 2.4% | 2.0% |
| Standard Deviation (Sample) | 5.4% | 2.9% |
| Standard Deviation (Population) | 5.4% | 2.9% |
Demographics Similar to Bahamians and Maltese by Disability Age 18 to 34
In terms of disability age 18 to 34, the demographic groups most similar to Bahamians are Ghanaian (6.6%, a difference of 0.050%), Immigrants from Mexico (6.6%, a difference of 0.10%), Immigrants from Bahamas (6.6%, a difference of 0.17%), Russian (6.5%, a difference of 0.34%), and Native Hawaiian (6.6%, a difference of 0.38%). Similarly, the demographic groups most similar to Maltese are Immigrants from Cameroon (6.7%, a difference of 0.020%), Immigrants from Oceania (6.7%, a difference of 0.040%), Yup'ik (6.7%, a difference of 0.040%), Pakistani (6.7%, a difference of 0.090%), and Immigrants from Iraq (6.7%, a difference of 0.19%).
| Demographics | Rating | Rank | Disability Age 18 to 34 |
| Russians | 60.2 /100 | #169 | Good 6.5% |
| Immigrants | Bahamas | 57.9 /100 | #170 | Average 6.6% |
| Bahamians | 55.5 /100 | #171 | Average 6.6% |
| Ghanaians | 54.7 /100 | #172 | Average 6.6% |
| Immigrants | Mexico | 54.1 /100 | #173 | Average 6.6% |
| Native Hawaiians | 50.0 /100 | #174 | Average 6.6% |
| Immigrants | Cambodia | 46.5 /100 | #175 | Average 6.6% |
| Immigrants | Africa | 45.9 /100 | #176 | Average 6.6% |
| Syrians | 44.3 /100 | #177 | Average 6.6% |
| Nigerians | 43.7 /100 | #178 | Average 6.6% |
| Immigrants | Ghana | 42.1 /100 | #179 | Average 6.6% |
| Immigrants | Austria | 39.6 /100 | #180 | Fair 6.6% |
| Romanians | 39.5 /100 | #181 | Fair 6.6% |
| U.S. Virgin Islanders | 38.6 /100 | #182 | Fair 6.7% |
| Immigrants | Iraq | 37.4 /100 | #183 | Fair 6.7% |
| Iraqis | 37.4 /100 | #184 | Fair 6.7% |
| Immigrants | Oceania | 35.4 /100 | #185 | Fair 6.7% |
| Yup'ik | 35.3 /100 | #186 | Fair 6.7% |
| Maltese | 34.8 /100 | #187 | Fair 6.7% |
| Immigrants | Cameroon | 34.5 /100 | #188 | Fair 6.7% |
| Pakistanis | 33.7 /100 | #189 | Fair 6.7% |