Assyrian/Chaldean/Syriac vs Maltese Male Unemployment
COMPARE
Assyrian/Chaldean/Syriac
Maltese
Male Unemployment
Male Unemployment Comparison
Assyrians/Chaldeans/Syriacs
Maltese
5.0%
MALE UNEMPLOYMENT
96.9/ 100
METRIC RATING
75th/ 347
METRIC RANK
5.1%
MALE UNEMPLOYMENT
95.5/ 100
METRIC RATING
86th/ 347
METRIC RANK
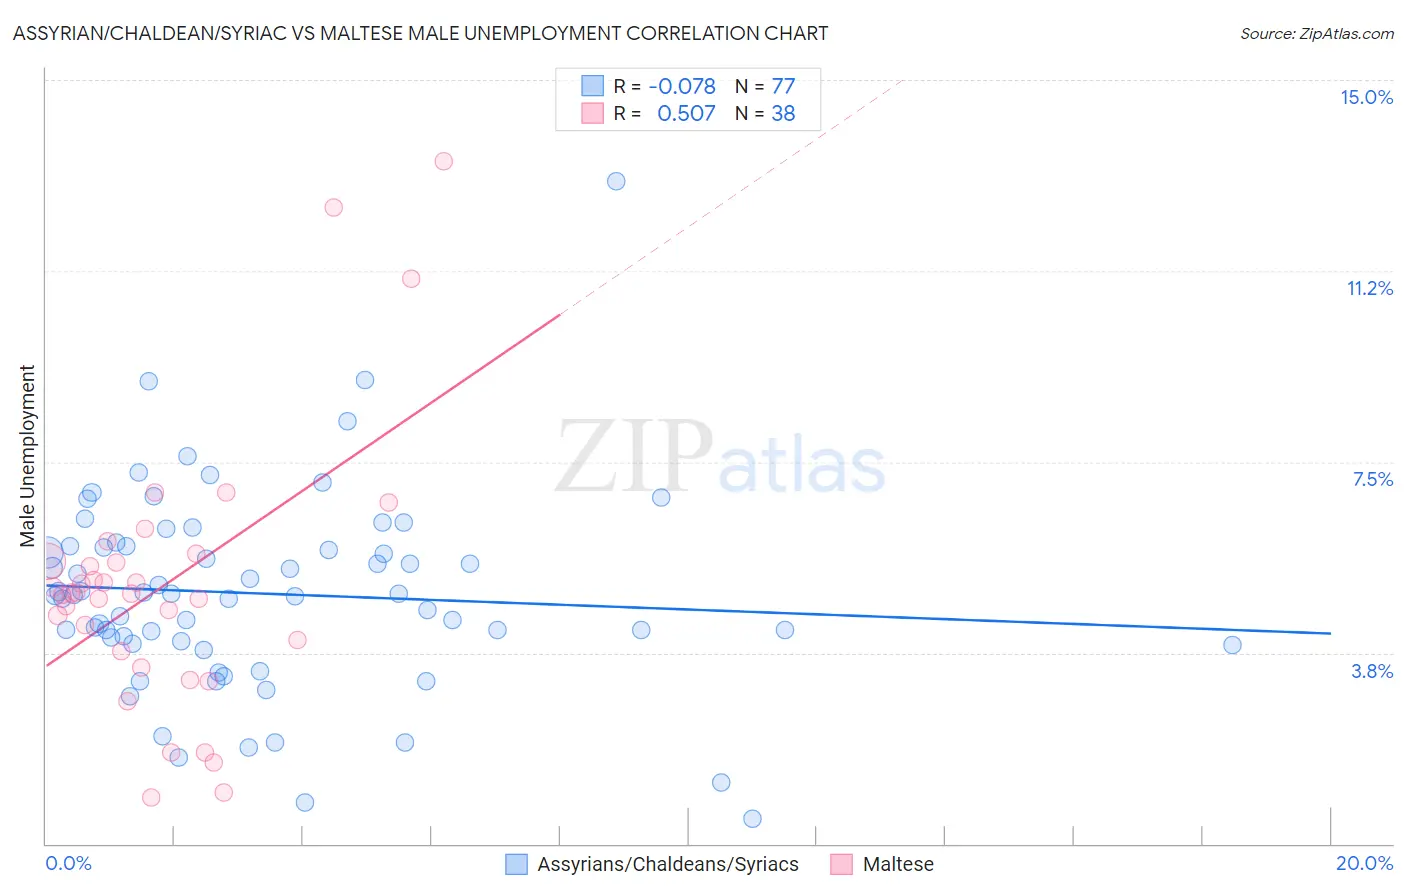
Assyrian/Chaldean/Syriac vs Maltese Male Unemployment Correlation Chart
The statistical analysis conducted on geographies consisting of 110,205,366 people shows a slight negative correlation between the proportion of Assyrians/Chaldeans/Syriacs and unemployment rate among males in the United States with a correlation coefficient (R) of -0.078 and weighted average of 5.0%. Similarly, the statistical analysis conducted on geographies consisting of 126,309,580 people shows a substantial positive correlation between the proportion of Maltese and unemployment rate among males in the United States with a correlation coefficient (R) of 0.507 and weighted average of 5.1%, a difference of 0.59%.
Male Unemployment Correlation Summary
| Measurement | Assyrian/Chaldean/Syriac | Maltese |
| Minimum | 0.50% | 0.90% |
| Maximum | 13.0% | 13.4% |
| Range | 12.5% | 12.5% |
| Mean | 4.9% | 5.1% |
| Median | 4.9% | 4.9% |
| Interquartile 25% (IQ1) | 3.9% | 3.8% |
| Interquartile 75% (IQ3) | 5.8% | 5.5% |
| Interquartile Range (IQR) | 1.9% | 1.8% |
| Standard Deviation (Sample) | 2.0% | 2.6% |
| Standard Deviation (Population) | 2.0% | 2.6% |
Demographics Similar to Assyrians/Chaldeans/Syriacs and Maltese by Male Unemployment
In terms of male unemployment, the demographic groups most similar to Assyrians/Chaldeans/Syriacs are Immigrants from North America (5.0%, a difference of 0.030%), Greek (5.0%, a difference of 0.060%), Immigrants from South Africa (5.0%, a difference of 0.14%), Immigrants from Sudan (5.0%, a difference of 0.16%), and Iranian (5.0%, a difference of 0.21%). Similarly, the demographic groups most similar to Maltese are Immigrants from Romania (5.1%, a difference of 0.020%), Immigrants from North Macedonia (5.1%, a difference of 0.040%), Serbian (5.1%, a difference of 0.090%), Immigrants from Sri Lanka (5.1%, a difference of 0.20%), and Immigrants from Eritrea (5.0%, a difference of 0.21%).
| Demographics | Rating | Rank | Male Unemployment |
| Whites/Caucasians | 97.3 /100 | #70 | Exceptional 5.0% |
| New Zealanders | 97.3 /100 | #71 | Exceptional 5.0% |
| Immigrants | South Africa | 97.1 /100 | #72 | Exceptional 5.0% |
| Greeks | 97.0 /100 | #73 | Exceptional 5.0% |
| Immigrants | North America | 96.9 /100 | #74 | Exceptional 5.0% |
| Assyrians/Chaldeans/Syriacs | 96.9 /100 | #75 | Exceptional 5.0% |
| Immigrants | Sudan | 96.5 /100 | #76 | Exceptional 5.0% |
| Iranians | 96.4 /100 | #77 | Exceptional 5.0% |
| Immigrants | Northern Europe | 96.4 /100 | #78 | Exceptional 5.0% |
| South Africans | 96.4 /100 | #79 | Exceptional 5.0% |
| Argentineans | 96.2 /100 | #80 | Exceptional 5.0% |
| French | 96.2 /100 | #81 | Exceptional 5.0% |
| Chileans | 96.2 /100 | #82 | Exceptional 5.0% |
| Immigrants | Eritrea | 96.0 /100 | #83 | Exceptional 5.0% |
| Serbians | 95.7 /100 | #84 | Exceptional 5.1% |
| Immigrants | North Macedonia | 95.6 /100 | #85 | Exceptional 5.1% |
| Maltese | 95.5 /100 | #86 | Exceptional 5.1% |
| Immigrants | Romania | 95.4 /100 | #87 | Exceptional 5.1% |
| Immigrants | Sri Lanka | 94.9 /100 | #88 | Exceptional 5.1% |
| Immigrants | Australia | 94.7 /100 | #89 | Exceptional 5.1% |
| Okinawans | 94.7 /100 | #90 | Exceptional 5.1% |