Colville vs Immigrants from Denmark Disability Age Over 75
COMPARE
Colville
Immigrants from Denmark
Disability Age Over 75
Disability Age Over 75 Comparison
Colville
Immigrants from Denmark
55.4%
DISABILITY AGE OVER 75
0.0/ 100
METRIC RATING
338th/ 347
METRIC RANK
45.4%
DISABILITY AGE OVER 75
99.9/ 100
METRIC RATING
30th/ 347
METRIC RANK
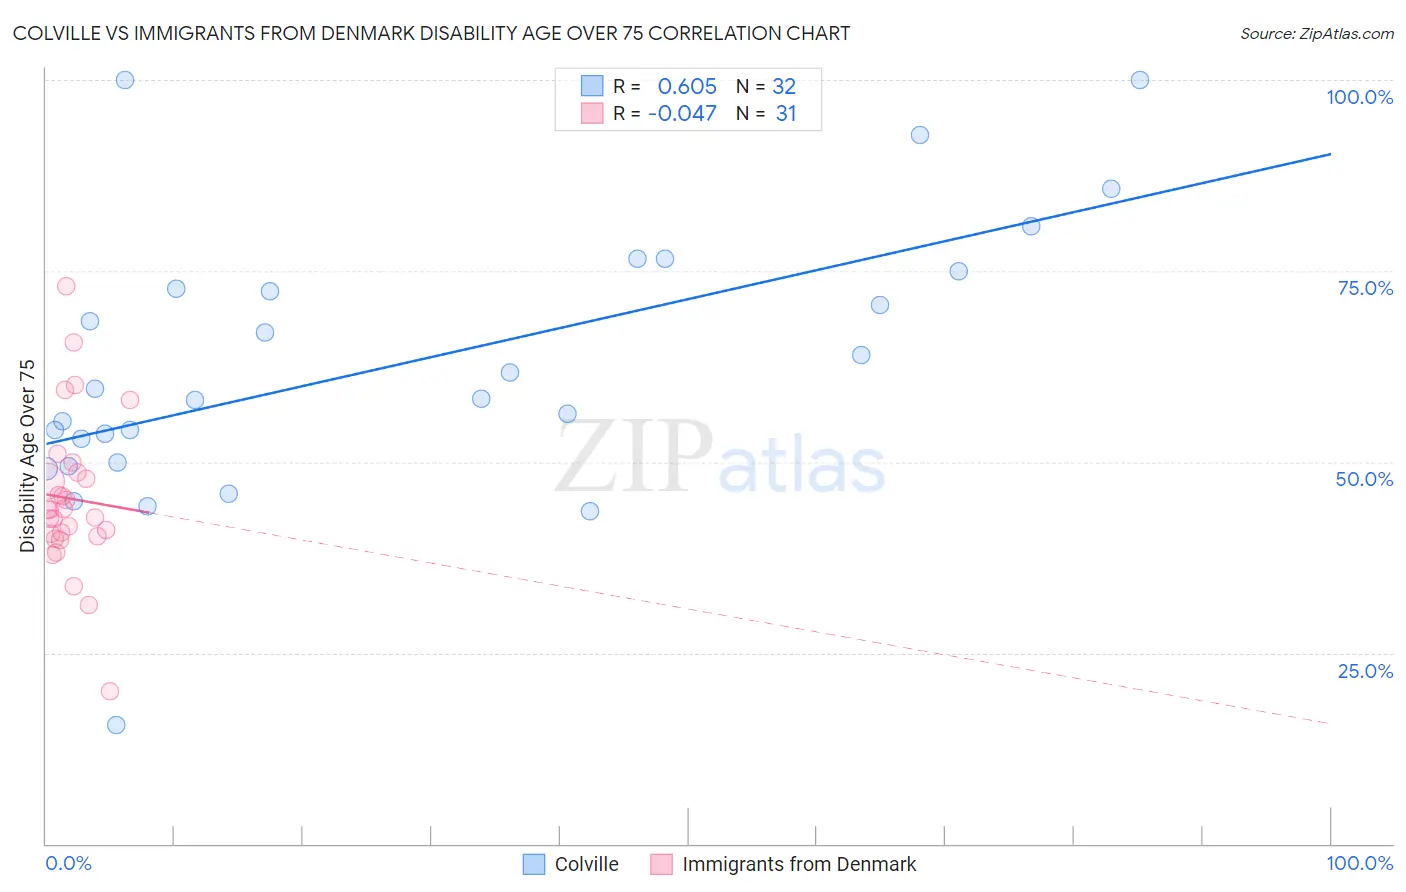
Colville vs Immigrants from Denmark Disability Age Over 75 Correlation Chart
The statistical analysis conducted on geographies consisting of 34,670,841 people shows a significant positive correlation between the proportion of Colville and percentage of population with a disability over the age of 75 in the United States with a correlation coefficient (R) of 0.605 and weighted average of 55.4%. Similarly, the statistical analysis conducted on geographies consisting of 136,379,730 people shows no correlation between the proportion of Immigrants from Denmark and percentage of population with a disability over the age of 75 in the United States with a correlation coefficient (R) of -0.047 and weighted average of 45.4%, a difference of 21.9%.
Disability Age Over 75 Correlation Summary
| Measurement | Colville | Immigrants from Denmark |
| Minimum | 15.6% | 20.0% |
| Maximum | 100.0% | 73.0% |
| Range | 84.4% | 53.0% |
| Mean | 62.8% | 45.2% |
| Median | 58.9% | 43.7% |
| Interquartile 25% (IQ1) | 51.5% | 40.2% |
| Interquartile 75% (IQ3) | 73.8% | 48.6% |
| Interquartile Range (IQR) | 22.3% | 8.4% |
| Standard Deviation (Sample) | 17.9% | 10.2% |
| Standard Deviation (Population) | 17.6% | 10.0% |
Similar Demographics by Disability Age Over 75
Demographics Similar to Colville by Disability Age Over 75
In terms of disability age over 75, the demographic groups most similar to Colville are Pima (55.8%, a difference of 0.82%), Pueblo (55.9%, a difference of 0.90%), Houma (56.2%, a difference of 1.4%), Lumbee (56.2%, a difference of 1.6%), and Yuman (54.4%, a difference of 1.8%).
| Demographics | Rating | Rank | Disability Age Over 75 |
| Hopi | 0.0 /100 | #331 | Tragic 52.9% |
| Natives/Alaskans | 0.0 /100 | #332 | Tragic 53.1% |
| Apache | 0.0 /100 | #333 | Tragic 53.6% |
| Alaskan Athabascans | 0.0 /100 | #334 | Tragic 54.0% |
| Kiowa | 0.0 /100 | #335 | Tragic 54.2% |
| Immigrants | Armenia | 0.0 /100 | #336 | Tragic 54.3% |
| Yuman | 0.0 /100 | #337 | Tragic 54.4% |
| Colville | 0.0 /100 | #338 | Tragic 55.4% |
| Pima | 0.0 /100 | #339 | Tragic 55.8% |
| Pueblo | 0.0 /100 | #340 | Tragic 55.9% |
| Houma | 0.0 /100 | #341 | Tragic 56.2% |
| Lumbee | 0.0 /100 | #342 | Tragic 56.2% |
| Tohono O'odham | 0.0 /100 | #343 | Tragic 56.7% |
| Navajo | 0.0 /100 | #344 | Tragic 58.3% |
| Inupiat | 0.0 /100 | #345 | Tragic 58.4% |
Demographics Similar to Immigrants from Denmark by Disability Age Over 75
In terms of disability age over 75, the demographic groups most similar to Immigrants from Denmark are Filipino (45.4%, a difference of 0.030%), Thai (45.4%, a difference of 0.070%), Immigrants from Bulgaria (45.5%, a difference of 0.070%), Immigrants from Poland (45.4%, a difference of 0.090%), and Macedonian (45.4%, a difference of 0.10%).
| Demographics | Rating | Rank | Disability Age Over 75 |
| Immigrants | Switzerland | 99.9 /100 | #23 | Exceptional 45.3% |
| Poles | 99.9 /100 | #24 | Exceptional 45.3% |
| Immigrants | Bolivia | 99.9 /100 | #25 | Exceptional 45.4% |
| Macedonians | 99.9 /100 | #26 | Exceptional 45.4% |
| Immigrants | Poland | 99.9 /100 | #27 | Exceptional 45.4% |
| Thais | 99.9 /100 | #28 | Exceptional 45.4% |
| Filipinos | 99.9 /100 | #29 | Exceptional 45.4% |
| Immigrants | Denmark | 99.9 /100 | #30 | Exceptional 45.4% |
| Immigrants | Bulgaria | 99.9 /100 | #31 | Exceptional 45.5% |
| Immigrants | Australia | 99.9 /100 | #32 | Exceptional 45.5% |
| Immigrants | Croatia | 99.9 /100 | #33 | Exceptional 45.5% |
| Russians | 99.9 /100 | #34 | Exceptional 45.5% |
| Norwegians | 99.9 /100 | #35 | Exceptional 45.5% |
| Immigrants | Taiwan | 99.9 /100 | #36 | Exceptional 45.5% |
| South Africans | 99.9 /100 | #37 | Exceptional 45.5% |