Assyrian/Chaldean/Syriac vs Immigrants from Australia Vision Disability
COMPARE
Assyrian/Chaldean/Syriac
Immigrants from Australia
Vision Disability
Vision Disability Comparison
Assyrians/Chaldeans/Syriacs
Immigrants from Australia
2.0%
VISION DISABILITY
98.1/ 100
METRIC RATING
79th/ 347
METRIC RANK
1.9%
VISION DISABILITY
99.8/ 100
METRIC RATING
35th/ 347
METRIC RANK
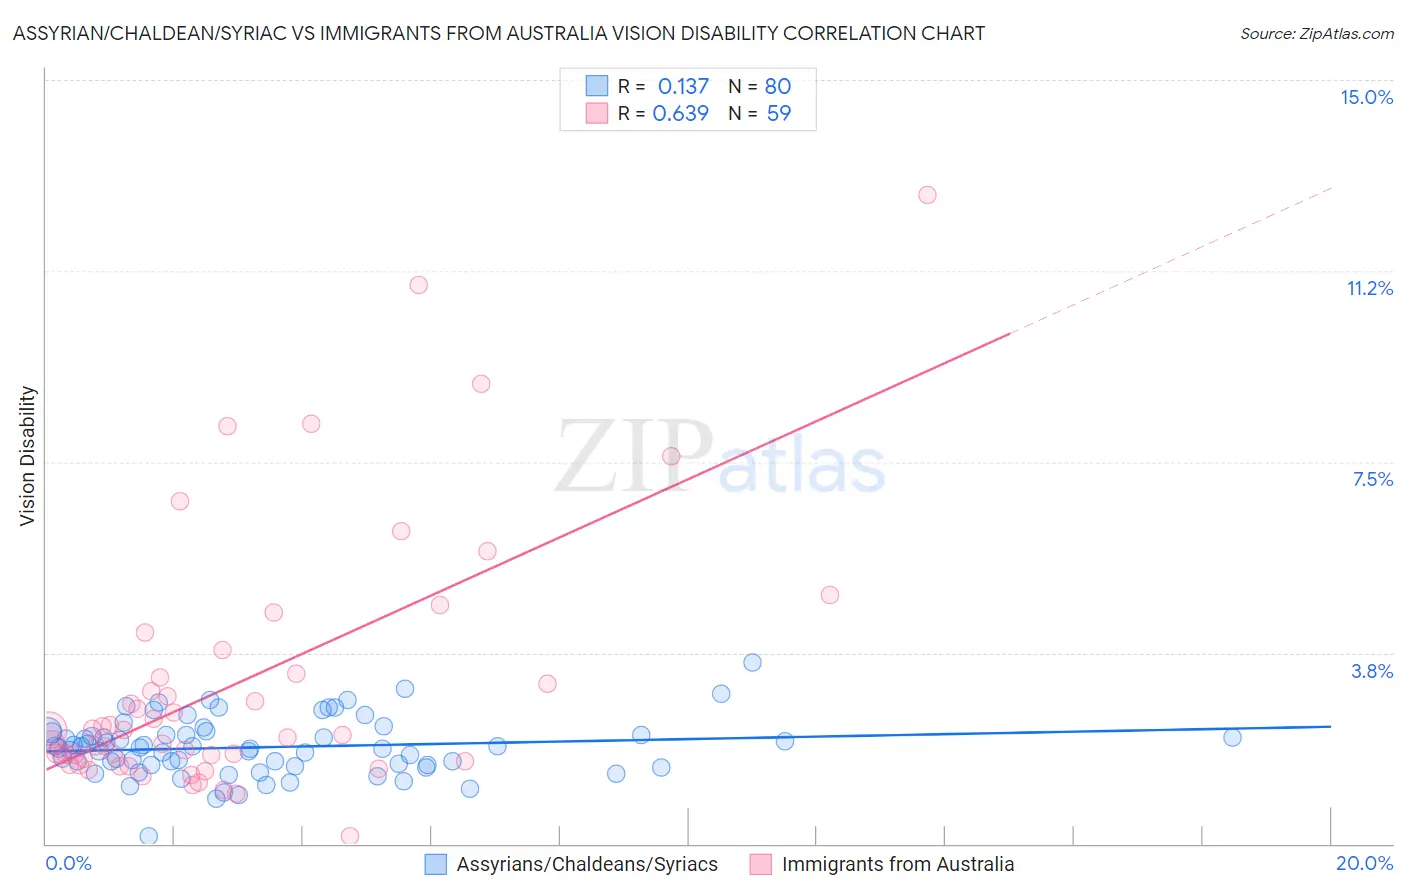
Assyrian/Chaldean/Syriac vs Immigrants from Australia Vision Disability Correlation Chart
The statistical analysis conducted on geographies consisting of 110,300,168 people shows a poor positive correlation between the proportion of Assyrians/Chaldeans/Syriacs and percentage of population with vision disability in the United States with a correlation coefficient (R) of 0.137 and weighted average of 2.0%. Similarly, the statistical analysis conducted on geographies consisting of 227,117,952 people shows a significant positive correlation between the proportion of Immigrants from Australia and percentage of population with vision disability in the United States with a correlation coefficient (R) of 0.639 and weighted average of 1.9%, a difference of 4.3%.
Vision Disability Correlation Summary
| Measurement | Assyrian/Chaldean/Syriac | Immigrants from Australia |
| Minimum | 0.15% | 0.16% |
| Maximum | 3.6% | 12.7% |
| Range | 3.4% | 12.6% |
| Mean | 1.9% | 3.1% |
| Median | 1.9% | 2.1% |
| Interquartile 25% (IQ1) | 1.6% | 1.6% |
| Interquartile 75% (IQ3) | 2.2% | 3.3% |
| Interquartile Range (IQR) | 0.61% | 1.7% |
| Standard Deviation (Sample) | 0.57% | 2.6% |
| Standard Deviation (Population) | 0.56% | 2.5% |
Similar Demographics by Vision Disability
Demographics Similar to Assyrians/Chaldeans/Syriacs by Vision Disability
In terms of vision disability, the demographic groups most similar to Assyrians/Chaldeans/Syriacs are Immigrants from Eastern Europe (2.0%, a difference of 0.18%), Paraguayan (2.0%, a difference of 0.21%), Immigrants from Jordan (2.0%, a difference of 0.21%), Palestinian (2.0%, a difference of 0.23%), and Immigrants from North Macedonia (2.0%, a difference of 0.23%).
| Demographics | Rating | Rank | Vision Disability |
| Immigrants | France | 98.5 /100 | #72 | Exceptional 2.0% |
| Immigrants | Eritrea | 98.4 /100 | #73 | Exceptional 2.0% |
| Palestinians | 98.3 /100 | #74 | Exceptional 2.0% |
| Immigrants | North Macedonia | 98.3 /100 | #75 | Exceptional 2.0% |
| Paraguayans | 98.3 /100 | #76 | Exceptional 2.0% |
| Immigrants | Jordan | 98.3 /100 | #77 | Exceptional 2.0% |
| Immigrants | Eastern Europe | 98.3 /100 | #78 | Exceptional 2.0% |
| Assyrians/Chaldeans/Syriacs | 98.1 /100 | #79 | Exceptional 2.0% |
| Lithuanians | 97.7 /100 | #80 | Exceptional 2.0% |
| Soviet Union | 97.6 /100 | #81 | Exceptional 2.0% |
| Immigrants | Poland | 97.6 /100 | #82 | Exceptional 2.0% |
| Immigrants | Western Asia | 97.5 /100 | #83 | Exceptional 2.0% |
| Immigrants | Latvia | 97.3 /100 | #84 | Exceptional 2.0% |
| Chinese | 97.2 /100 | #85 | Exceptional 2.0% |
| Immigrants | Moldova | 97.2 /100 | #86 | Exceptional 2.0% |
Demographics Similar to Immigrants from Australia by Vision Disability
In terms of vision disability, the demographic groups most similar to Immigrants from Australia are Immigrants from Turkey (1.9%, a difference of 0.10%), Immigrants from Egypt (1.9%, a difference of 0.22%), Cambodian (2.0%, a difference of 0.35%), Luxembourger (1.9%, a difference of 0.53%), and Bhutanese (2.0%, a difference of 0.60%).
| Demographics | Rating | Rank | Vision Disability |
| Immigrants | Malaysia | 99.9 /100 | #28 | Exceptional 1.9% |
| Egyptians | 99.9 /100 | #29 | Exceptional 1.9% |
| Immigrants | Nepal | 99.9 /100 | #30 | Exceptional 1.9% |
| Mongolians | 99.9 /100 | #31 | Exceptional 1.9% |
| Luxembourgers | 99.9 /100 | #32 | Exceptional 1.9% |
| Immigrants | Egypt | 99.9 /100 | #33 | Exceptional 1.9% |
| Immigrants | Turkey | 99.8 /100 | #34 | Exceptional 1.9% |
| Immigrants | Australia | 99.8 /100 | #35 | Exceptional 1.9% |
| Cambodians | 99.8 /100 | #36 | Exceptional 2.0% |
| Bhutanese | 99.8 /100 | #37 | Exceptional 2.0% |
| Immigrants | Kuwait | 99.8 /100 | #38 | Exceptional 2.0% |
| Zimbabweans | 99.7 /100 | #39 | Exceptional 2.0% |
| Immigrants | Ireland | 99.7 /100 | #40 | Exceptional 2.0% |
| Cypriots | 99.7 /100 | #41 | Exceptional 2.0% |
| Immigrants | Ethiopia | 99.7 /100 | #42 | Exceptional 2.0% |