Assyrian/Chaldean/Syriac vs Panamanian Vision Disability
COMPARE
Assyrian/Chaldean/Syriac
Panamanian
Vision Disability
Vision Disability Comparison
Assyrians/Chaldeans/Syriacs
Panamanians
2.0%
VISION DISABILITY
98.1/ 100
METRIC RATING
79th/ 347
METRIC RANK
2.3%
VISION DISABILITY
0.9/ 100
METRIC RATING
240th/ 347
METRIC RANK
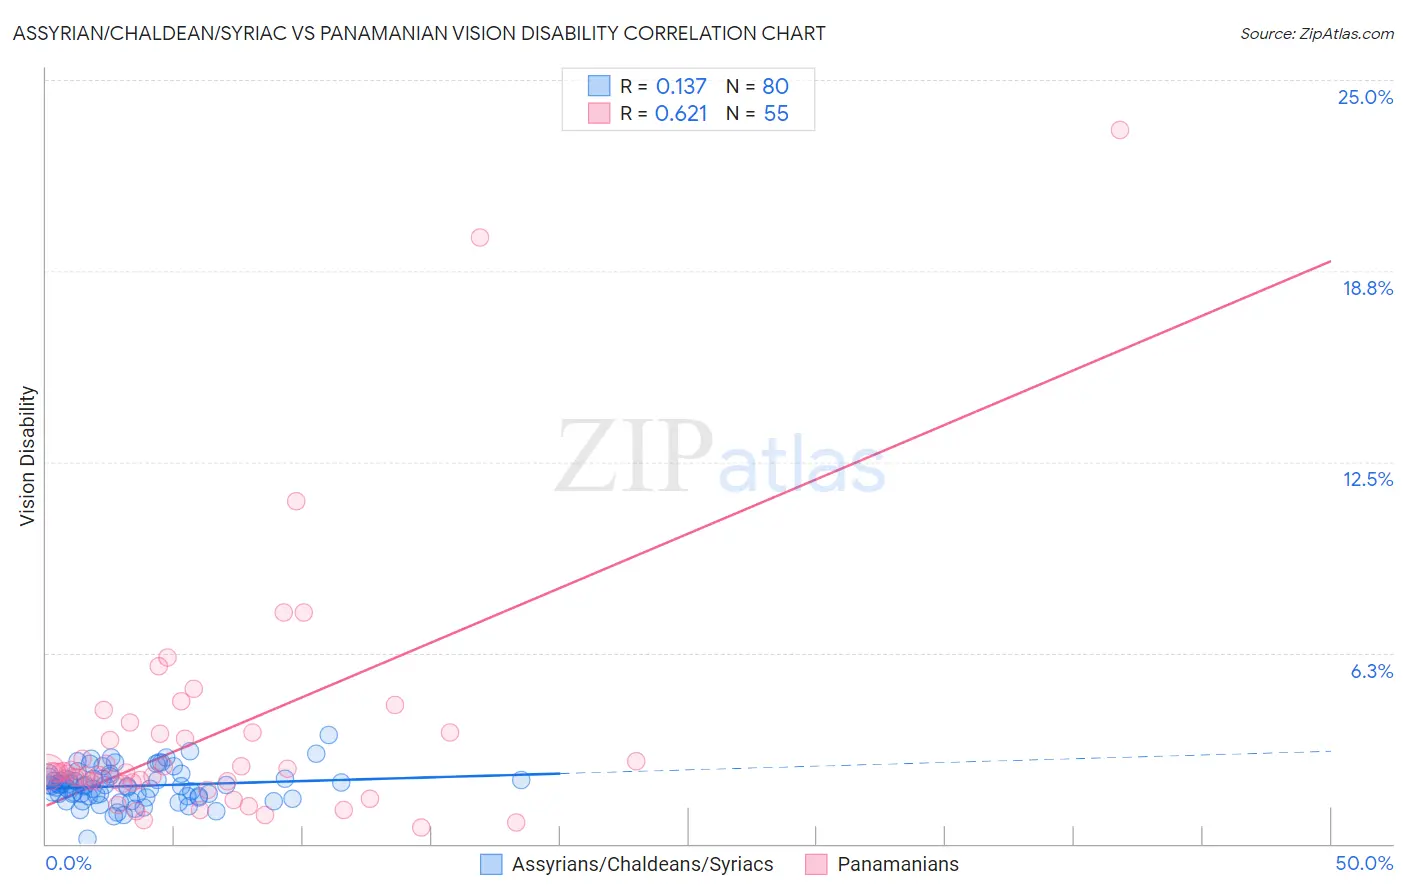
Assyrian/Chaldean/Syriac vs Panamanian Vision Disability Correlation Chart
The statistical analysis conducted on geographies consisting of 110,300,168 people shows a poor positive correlation between the proportion of Assyrians/Chaldeans/Syriacs and percentage of population with vision disability in the United States with a correlation coefficient (R) of 0.137 and weighted average of 2.0%. Similarly, the statistical analysis conducted on geographies consisting of 281,084,996 people shows a significant positive correlation between the proportion of Panamanians and percentage of population with vision disability in the United States with a correlation coefficient (R) of 0.621 and weighted average of 2.3%, a difference of 14.4%.
Vision Disability Correlation Summary
| Measurement | Assyrian/Chaldean/Syriac | Panamanian |
| Minimum | 0.15% | 0.54% |
| Maximum | 3.6% | 23.4% |
| Range | 3.4% | 22.8% |
| Mean | 1.9% | 3.5% |
| Median | 1.9% | 2.3% |
| Interquartile 25% (IQ1) | 1.6% | 2.0% |
| Interquartile 75% (IQ3) | 2.2% | 3.6% |
| Interquartile Range (IQR) | 0.61% | 1.6% |
| Standard Deviation (Sample) | 0.57% | 4.0% |
| Standard Deviation (Population) | 0.56% | 4.0% |
Similar Demographics by Vision Disability
Demographics Similar to Assyrians/Chaldeans/Syriacs by Vision Disability
In terms of vision disability, the demographic groups most similar to Assyrians/Chaldeans/Syriacs are Immigrants from Eastern Europe (2.0%, a difference of 0.18%), Paraguayan (2.0%, a difference of 0.21%), Immigrants from Jordan (2.0%, a difference of 0.21%), Palestinian (2.0%, a difference of 0.23%), and Immigrants from North Macedonia (2.0%, a difference of 0.23%).
| Demographics | Rating | Rank | Vision Disability |
| Immigrants | France | 98.5 /100 | #72 | Exceptional 2.0% |
| Immigrants | Eritrea | 98.4 /100 | #73 | Exceptional 2.0% |
| Palestinians | 98.3 /100 | #74 | Exceptional 2.0% |
| Immigrants | North Macedonia | 98.3 /100 | #75 | Exceptional 2.0% |
| Paraguayans | 98.3 /100 | #76 | Exceptional 2.0% |
| Immigrants | Jordan | 98.3 /100 | #77 | Exceptional 2.0% |
| Immigrants | Eastern Europe | 98.3 /100 | #78 | Exceptional 2.0% |
| Assyrians/Chaldeans/Syriacs | 98.1 /100 | #79 | Exceptional 2.0% |
| Lithuanians | 97.7 /100 | #80 | Exceptional 2.0% |
| Soviet Union | 97.6 /100 | #81 | Exceptional 2.0% |
| Immigrants | Poland | 97.6 /100 | #82 | Exceptional 2.0% |
| Immigrants | Western Asia | 97.5 /100 | #83 | Exceptional 2.0% |
| Immigrants | Latvia | 97.3 /100 | #84 | Exceptional 2.0% |
| Chinese | 97.2 /100 | #85 | Exceptional 2.0% |
| Immigrants | Moldova | 97.2 /100 | #86 | Exceptional 2.0% |
Demographics Similar to Panamanians by Vision Disability
In terms of vision disability, the demographic groups most similar to Panamanians are Malaysian (2.3%, a difference of 0.030%), Immigrants from Panama (2.3%, a difference of 0.18%), English (2.3%, a difference of 0.25%), Immigrants from Cambodia (2.3%, a difference of 0.27%), and Immigrants from Portugal (2.3%, a difference of 0.54%).
| Demographics | Rating | Rank | Vision Disability |
| Central Americans | 1.8 /100 | #233 | Tragic 2.3% |
| Scottish | 1.6 /100 | #234 | Tragic 2.3% |
| Marshallese | 1.5 /100 | #235 | Tragic 2.3% |
| Immigrants | Congo | 1.4 /100 | #236 | Tragic 2.3% |
| Immigrants | Portugal | 1.4 /100 | #237 | Tragic 2.3% |
| Immigrants | Cambodia | 1.1 /100 | #238 | Tragic 2.3% |
| English | 1.1 /100 | #239 | Tragic 2.3% |
| Panamanians | 0.9 /100 | #240 | Tragic 2.3% |
| Malaysians | 0.9 /100 | #241 | Tragic 2.3% |
| Immigrants | Panama | 0.8 /100 | #242 | Tragic 2.3% |
| Immigrants | Nicaragua | 0.6 /100 | #243 | Tragic 2.3% |
| Immigrants | West Indies | 0.6 /100 | #244 | Tragic 2.3% |
| Alsatians | 0.6 /100 | #245 | Tragic 2.3% |
| French | 0.5 /100 | #246 | Tragic 2.3% |
| Guatemalans | 0.5 /100 | #247 | Tragic 2.3% |