Ottawa vs Immigrants from Australia Vision Disability
COMPARE
Ottawa
Immigrants from Australia
Vision Disability
Vision Disability Comparison
Ottawa
Immigrants from Australia
2.5%
VISION DISABILITY
0.0/ 100
METRIC RATING
294th/ 347
METRIC RANK
1.9%
VISION DISABILITY
99.8/ 100
METRIC RATING
35th/ 347
METRIC RANK
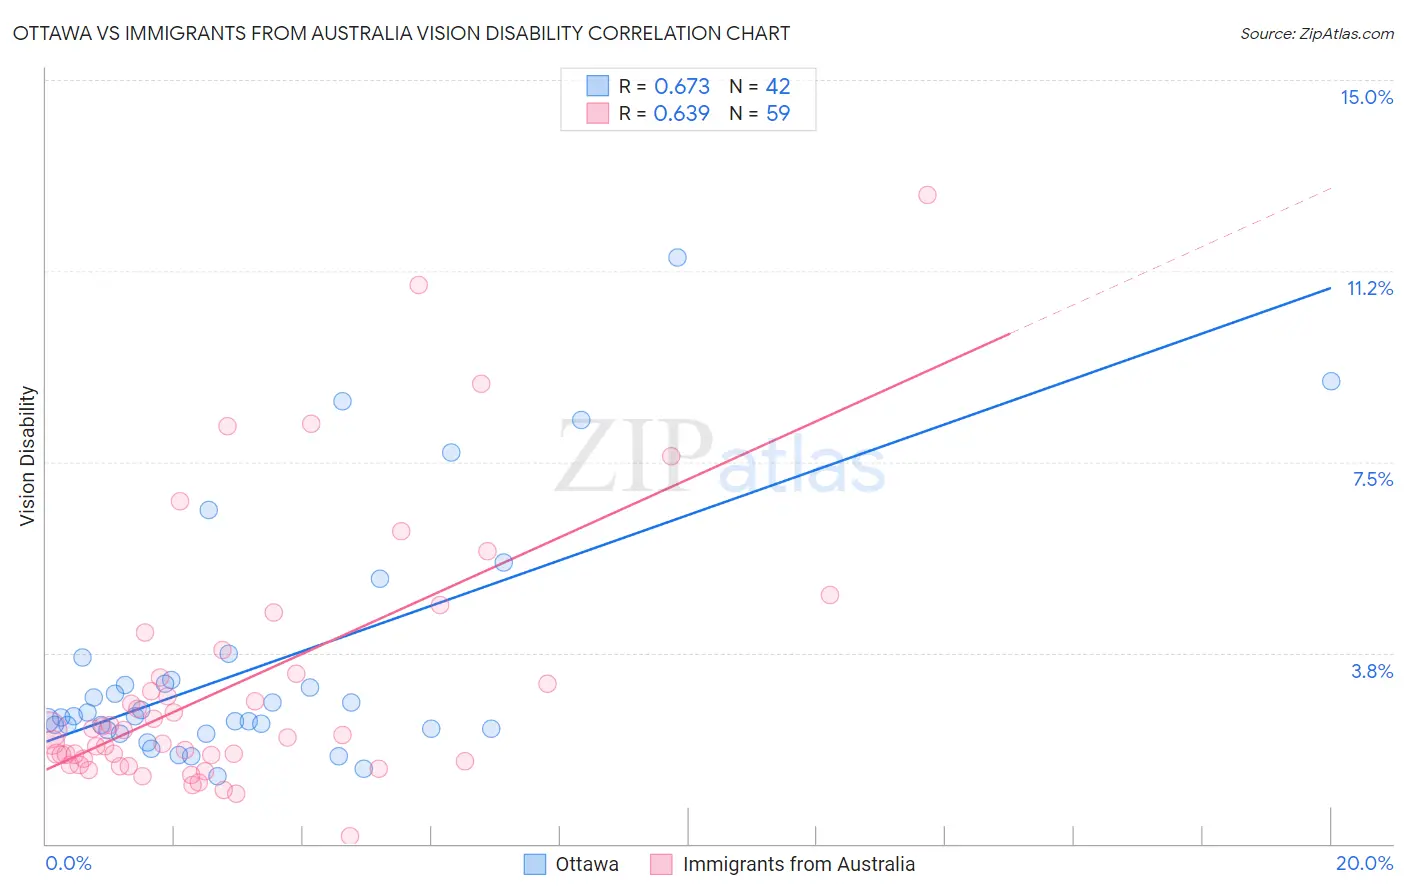
Ottawa vs Immigrants from Australia Vision Disability Correlation Chart
The statistical analysis conducted on geographies consisting of 49,950,834 people shows a significant positive correlation between the proportion of Ottawa and percentage of population with vision disability in the United States with a correlation coefficient (R) of 0.673 and weighted average of 2.5%. Similarly, the statistical analysis conducted on geographies consisting of 227,117,952 people shows a significant positive correlation between the proportion of Immigrants from Australia and percentage of population with vision disability in the United States with a correlation coefficient (R) of 0.639 and weighted average of 1.9%, a difference of 28.5%.
Vision Disability Correlation Summary
| Measurement | Ottawa | Immigrants from Australia |
| Minimum | 1.3% | 0.16% |
| Maximum | 11.5% | 12.7% |
| Range | 10.2% | 12.6% |
| Mean | 3.5% | 3.1% |
| Median | 2.5% | 2.1% |
| Interquartile 25% (IQ1) | 2.2% | 1.6% |
| Interquartile 75% (IQ3) | 3.2% | 3.3% |
| Interquartile Range (IQR) | 0.96% | 1.7% |
| Standard Deviation (Sample) | 2.4% | 2.6% |
| Standard Deviation (Population) | 2.3% | 2.5% |
Similar Demographics by Vision Disability
Demographics Similar to Ottawa by Vision Disability
In terms of vision disability, the demographic groups most similar to Ottawa are Delaware (2.5%, a difference of 0.21%), Immigrants from Mexico (2.5%, a difference of 0.32%), Yaqui (2.5%, a difference of 0.34%), Crow (2.5%, a difference of 0.36%), and Immigrants from Honduras (2.5%, a difference of 0.46%).
| Demographics | Rating | Rank | Vision Disability |
| Hondurans | 0.0 /100 | #287 | Tragic 2.5% |
| French American Indians | 0.0 /100 | #288 | Tragic 2.5% |
| Immigrants | Nonimmigrants | 0.0 /100 | #289 | Tragic 2.5% |
| Immigrants | Cuba | 0.0 /100 | #290 | Tragic 2.5% |
| Immigrants | Honduras | 0.0 /100 | #291 | Tragic 2.5% |
| Crow | 0.0 /100 | #292 | Tragic 2.5% |
| Yaqui | 0.0 /100 | #293 | Tragic 2.5% |
| Ottawa | 0.0 /100 | #294 | Tragic 2.5% |
| Delaware | 0.0 /100 | #295 | Tragic 2.5% |
| Immigrants | Mexico | 0.0 /100 | #296 | Tragic 2.5% |
| Immigrants | Dominica | 0.0 /100 | #297 | Tragic 2.5% |
| Mexicans | 0.0 /100 | #298 | Tragic 2.5% |
| Cree | 0.0 /100 | #299 | Tragic 2.5% |
| Africans | 0.0 /100 | #300 | Tragic 2.5% |
| Menominee | 0.0 /100 | #301 | Tragic 2.5% |
Demographics Similar to Immigrants from Australia by Vision Disability
In terms of vision disability, the demographic groups most similar to Immigrants from Australia are Immigrants from Turkey (1.9%, a difference of 0.10%), Immigrants from Egypt (1.9%, a difference of 0.22%), Cambodian (2.0%, a difference of 0.35%), Luxembourger (1.9%, a difference of 0.53%), and Bhutanese (2.0%, a difference of 0.60%).
| Demographics | Rating | Rank | Vision Disability |
| Immigrants | Malaysia | 99.9 /100 | #28 | Exceptional 1.9% |
| Egyptians | 99.9 /100 | #29 | Exceptional 1.9% |
| Immigrants | Nepal | 99.9 /100 | #30 | Exceptional 1.9% |
| Mongolians | 99.9 /100 | #31 | Exceptional 1.9% |
| Luxembourgers | 99.9 /100 | #32 | Exceptional 1.9% |
| Immigrants | Egypt | 99.9 /100 | #33 | Exceptional 1.9% |
| Immigrants | Turkey | 99.8 /100 | #34 | Exceptional 1.9% |
| Immigrants | Australia | 99.8 /100 | #35 | Exceptional 1.9% |
| Cambodians | 99.8 /100 | #36 | Exceptional 2.0% |
| Bhutanese | 99.8 /100 | #37 | Exceptional 2.0% |
| Immigrants | Kuwait | 99.8 /100 | #38 | Exceptional 2.0% |
| Zimbabweans | 99.7 /100 | #39 | Exceptional 2.0% |
| Immigrants | Ireland | 99.7 /100 | #40 | Exceptional 2.0% |
| Cypriots | 99.7 /100 | #41 | Exceptional 2.0% |
| Immigrants | Ethiopia | 99.7 /100 | #42 | Exceptional 2.0% |