Assyrian/Chaldean/Syriac vs Arab Unemployment Among Ages 45 to 54 years
COMPARE
Assyrian/Chaldean/Syriac
Arab
Unemployment Among Ages 45 to 54 years
Unemployment Among Ages 45 to 54 years Comparison
Assyrians/Chaldeans/Syriacs
Arabs
4.7%
UNEMPLOYMENT AMONG AGES 45 TO 54 YEARS
3.5/ 100
METRIC RATING
226th/ 347
METRIC RANK
4.6%
UNEMPLOYMENT AMONG AGES 45 TO 54 YEARS
13.7/ 100
METRIC RATING
207th/ 347
METRIC RANK
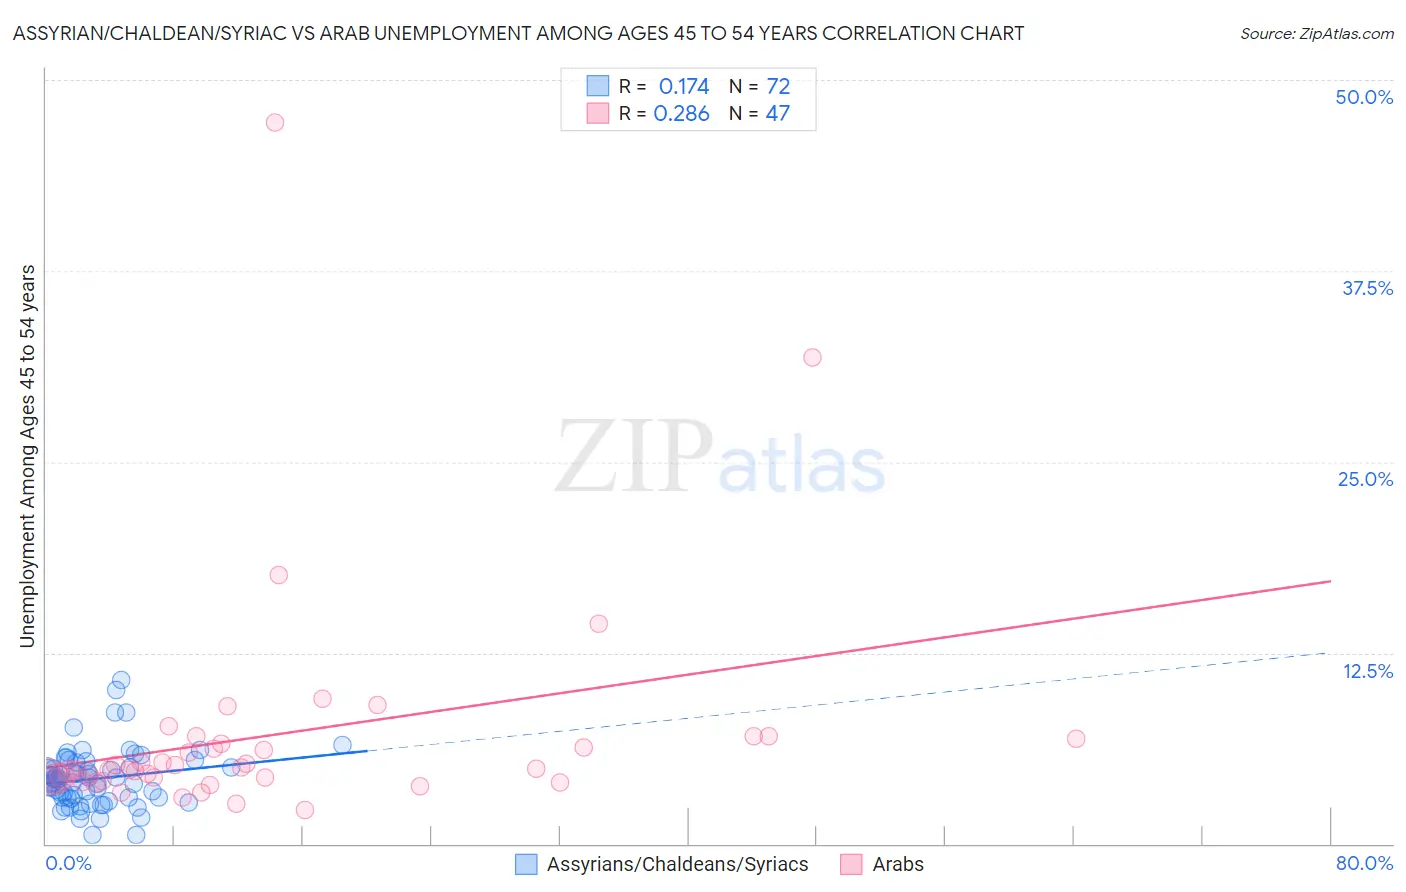
Assyrian/Chaldean/Syriac vs Arab Unemployment Among Ages 45 to 54 years Correlation Chart
The statistical analysis conducted on geographies consisting of 109,531,563 people shows a poor positive correlation between the proportion of Assyrians/Chaldeans/Syriacs and unemployment rate among population between the ages 45 and 54 in the United States with a correlation coefficient (R) of 0.174 and weighted average of 4.7%. Similarly, the statistical analysis conducted on geographies consisting of 468,693,746 people shows a weak positive correlation between the proportion of Arabs and unemployment rate among population between the ages 45 and 54 in the United States with a correlation coefficient (R) of 0.286 and weighted average of 4.6%, a difference of 1.7%.
Unemployment Among Ages 45 to 54 years Correlation Summary
| Measurement | Assyrian/Chaldean/Syriac | Arab |
| Minimum | 0.60% | 2.2% |
| Maximum | 10.7% | 47.2% |
| Range | 10.1% | 45.0% |
| Mean | 4.3% | 7.1% |
| Median | 4.2% | 4.9% |
| Interquartile 25% (IQ1) | 3.0% | 4.3% |
| Interquartile 75% (IQ3) | 5.2% | 6.9% |
| Interquartile Range (IQR) | 2.2% | 2.6% |
| Standard Deviation (Sample) | 1.9% | 7.6% |
| Standard Deviation (Population) | 1.9% | 7.5% |
Demographics Similar to Assyrians/Chaldeans/Syriacs and Arabs by Unemployment Among Ages 45 to 54 years
In terms of unemployment among ages 45 to 54 years, the demographic groups most similar to Assyrians/Chaldeans/Syriacs are Comanche (4.7%, a difference of 0.37%), Immigrants from Norway (4.7%, a difference of 0.37%), Potawatomi (4.7%, a difference of 0.58%), Immigrants from Southern Europe (4.7%, a difference of 0.64%), and Choctaw (4.7%, a difference of 0.67%). Similarly, the demographic groups most similar to Arabs are Immigrants from Africa (4.6%, a difference of 0.020%), Immigrants from Switzerland (4.6%, a difference of 0.030%), Immigrants from Nigeria (4.6%, a difference of 0.050%), Immigrants from South America (4.6%, a difference of 0.15%), and Creek (4.6%, a difference of 0.19%).
| Demographics | Rating | Rank | Unemployment Among Ages 45 to 54 years |
| Immigrants | Switzerland | 14.0 /100 | #206 | Poor 4.6% |
| Arabs | 13.7 /100 | #207 | Poor 4.6% |
| Immigrants | Africa | 13.6 /100 | #208 | Poor 4.6% |
| Immigrants | Nigeria | 13.3 /100 | #209 | Poor 4.6% |
| Immigrants | South America | 12.2 /100 | #210 | Poor 4.6% |
| Creek | 11.9 /100 | #211 | Poor 4.6% |
| Immigrants | Iran | 11.5 /100 | #212 | Poor 4.6% |
| Panamanians | 10.7 /100 | #213 | Poor 4.6% |
| Cherokee | 10.6 /100 | #214 | Poor 4.6% |
| Immigrants | Panama | 10.4 /100 | #215 | Poor 4.6% |
| Lumbee | 9.2 /100 | #216 | Tragic 4.6% |
| Immigrants | Cambodia | 7.4 /100 | #217 | Tragic 4.7% |
| Immigrants | Uganda | 7.1 /100 | #218 | Tragic 4.7% |
| Nigerians | 7.0 /100 | #219 | Tragic 4.7% |
| Guamanians/Chamorros | 6.8 /100 | #220 | Tragic 4.7% |
| Choctaw | 6.1 /100 | #221 | Tragic 4.7% |
| Immigrants | Southern Europe | 6.0 /100 | #222 | Tragic 4.7% |
| Potawatomi | 5.7 /100 | #223 | Tragic 4.7% |
| Comanche | 4.8 /100 | #224 | Tragic 4.7% |
| Immigrants | Norway | 4.8 /100 | #225 | Tragic 4.7% |
| Assyrians/Chaldeans/Syriacs | 3.5 /100 | #226 | Tragic 4.7% |