Asian vs Syrian Hearing Disability
COMPARE
Asian
Syrian
Hearing Disability
Hearing Disability Comparison
Asians
Syrians
2.7%
HEARING DISABILITY
97.5/ 100
METRIC RATING
76th/ 347
METRIC RANK
3.1%
HEARING DISABILITY
19.2/ 100
METRIC RATING
199th/ 347
METRIC RANK
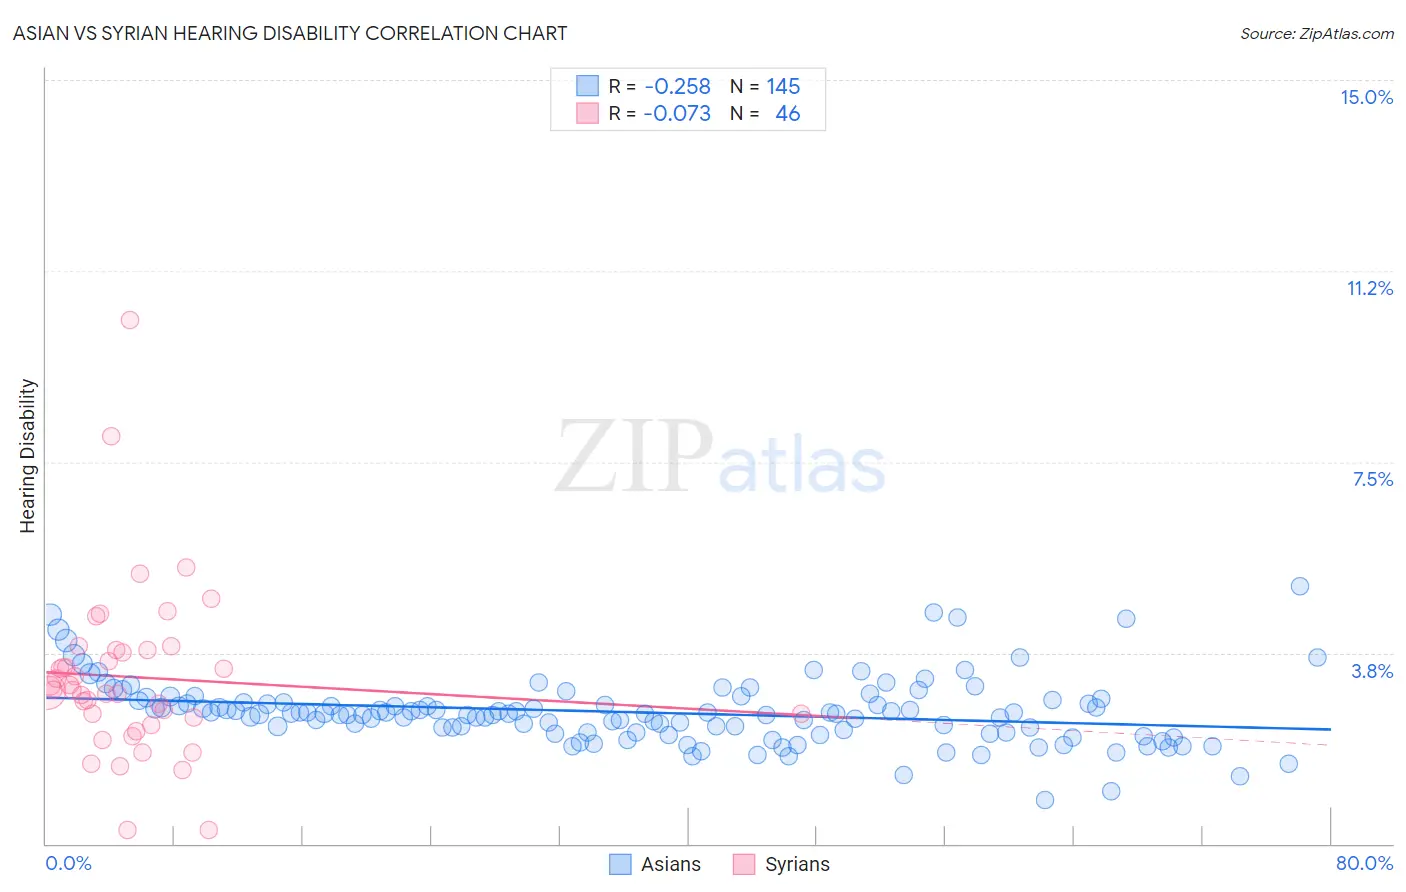
Asian vs Syrian Hearing Disability Correlation Chart
The statistical analysis conducted on geographies consisting of 550,340,322 people shows a weak negative correlation between the proportion of Asians and percentage of population with hearing disability in the United States with a correlation coefficient (R) of -0.258 and weighted average of 2.7%. Similarly, the statistical analysis conducted on geographies consisting of 266,258,902 people shows a slight negative correlation between the proportion of Syrians and percentage of population with hearing disability in the United States with a correlation coefficient (R) of -0.073 and weighted average of 3.1%, a difference of 13.1%.
Hearing Disability Correlation Summary
| Measurement | Asian | Syrian |
| Minimum | 0.87% | 0.27% |
| Maximum | 5.1% | 10.3% |
| Range | 4.2% | 10.0% |
| Mean | 2.6% | 3.3% |
| Median | 2.6% | 3.0% |
| Interquartile 25% (IQ1) | 2.2% | 2.5% |
| Interquartile 75% (IQ3) | 2.8% | 3.8% |
| Interquartile Range (IQR) | 0.60% | 1.3% |
| Standard Deviation (Sample) | 0.65% | 1.7% |
| Standard Deviation (Population) | 0.65% | 1.7% |
Similar Demographics by Hearing Disability
Demographics Similar to Asians by Hearing Disability
In terms of hearing disability, the demographic groups most similar to Asians are Immigrants from Saudi Arabia (2.7%, a difference of 0.0%), Immigrants from Malaysia (2.7%, a difference of 0.020%), Argentinean (2.7%, a difference of 0.030%), Immigrants from Korea (2.7%, a difference of 0.030%), and Mongolian (2.7%, a difference of 0.070%).
| Demographics | Rating | Rank | Hearing Disability |
| Nicaraguans | 97.9 /100 | #69 | Exceptional 2.7% |
| Peruvians | 97.7 /100 | #70 | Exceptional 2.7% |
| Central Americans | 97.7 /100 | #71 | Exceptional 2.7% |
| Afghans | 97.6 /100 | #72 | Exceptional 2.7% |
| Argentineans | 97.5 /100 | #73 | Exceptional 2.7% |
| Immigrants | Korea | 97.5 /100 | #74 | Exceptional 2.7% |
| Immigrants | Saudi Arabia | 97.5 /100 | #75 | Exceptional 2.7% |
| Asians | 97.5 /100 | #76 | Exceptional 2.7% |
| Immigrants | Malaysia | 97.5 /100 | #77 | Exceptional 2.7% |
| Mongolians | 97.4 /100 | #78 | Exceptional 2.7% |
| Colombians | 97.4 /100 | #79 | Exceptional 2.7% |
| Immigrants | Asia | 97.2 /100 | #80 | Exceptional 2.7% |
| Immigrants | Uruguay | 97.2 /100 | #81 | Exceptional 2.7% |
| Immigrants | Armenia | 97.2 /100 | #82 | Exceptional 2.7% |
| Immigrants | Cuba | 97.2 /100 | #83 | Exceptional 2.7% |
Demographics Similar to Syrians by Hearing Disability
In terms of hearing disability, the demographic groups most similar to Syrians are Immigrants from North Macedonia (3.1%, a difference of 0.010%), Iraqi (3.1%, a difference of 0.030%), Immigrants from Croatia (3.1%, a difference of 0.18%), Immigrants from Bosnia and Herzegovina (3.1%, a difference of 0.20%), and Immigrants from Thailand (3.1%, a difference of 0.43%).
| Demographics | Rating | Rank | Hearing Disability |
| Koreans | 27.6 /100 | #192 | Fair 3.1% |
| Macedonians | 27.0 /100 | #193 | Fair 3.1% |
| South Africans | 24.5 /100 | #194 | Fair 3.1% |
| Spanish American Indians | 24.1 /100 | #195 | Fair 3.1% |
| Immigrants | Europe | 22.9 /100 | #196 | Fair 3.1% |
| Immigrants | Bosnia and Herzegovina | 20.6 /100 | #197 | Fair 3.1% |
| Immigrants | Croatia | 20.5 /100 | #198 | Fair 3.1% |
| Syrians | 19.2 /100 | #199 | Poor 3.1% |
| Immigrants | North Macedonia | 19.1 /100 | #200 | Poor 3.1% |
| Iraqis | 19.0 /100 | #201 | Poor 3.1% |
| Immigrants | Thailand | 16.4 /100 | #202 | Poor 3.1% |
| Immigrants | Denmark | 16.2 /100 | #203 | Poor 3.1% |
| Immigrants | Czechoslovakia | 15.9 /100 | #204 | Poor 3.1% |
| Alsatians | 15.9 /100 | #205 | Poor 3.1% |
| Eastern Europeans | 15.5 /100 | #206 | Poor 3.1% |